DEPARTMENT OF NATURAL RESOURCES AND ENVIRONMENTAL CONTROL
Division of Air and Waste Management
General Notice
Register Notice
1. TITLE OF THE REGULATIONS: Revision to the Delaware State Implementation Plan (SIP) for Attainment of the PM2.5 Annual National Ambient Air Quality Standard
2. BRIEF SYNOPSIS OF THE SUBJECT, SUBSTANCE AND ISSUES: In April 2005 the Environmental Protection Agency (EPA) designated 126 areas of the country as “non-attainment” under the annual fine particle (PM2.5) National Ambient Air Quality Standard (NAAQS). Among those non-attainment areas is the Philadelphia-Wilmington, PA-NJ-DE Non-Attainment Area (NAA). This NAA includes New Castle County in Delaware. The purpose of this SIP is to:
A. Attainment Demonstration
B. 2002 Base Year Emissions Inventory
3. POSSIBLE TERMS OF THE AGENCY ACTION: None
4. STATUTORY BASIS OR LEGAL AUTHORITY TO ACT: 7 Delaware Code, Chapter 60, Environmental Control
5. OTHER REGULATIONS THAT MAY BE AFFECTED BY THE PROPOSAL: None
6. NOTICE OF PUBLIC COMMENT: The public comment period for this proposed SIP revision will extend through March 4, 2008. Interested parties may submit comments in writing during this time frame to John Sipple, Air Quality Management Section, 156 S. State St., Dover, DE 19901, and/or statements and testimony may be presented either orally or in writing at the public hearing to be held on Tuesday, March 4, 2008, beginning at 6:00 p.m. in the DNREC - Richardson & Robins Building Auditorium, 89 Kings Highway, Dover, DE 19901.
7. PREPARED BY:
John Sipple (302) 739-9402 January 2, 2008
Email address: john.sipple@state.de.us
Revision to the Delaware State Implementation Plan (SIP) for Attainment of the PM2.5 Annual National Ambient Air Quality Standard
January 3, 2008
Executive Summary
In April 2005 the Environmental Protection Agency (EPA) designated 126 areas of the country as “non-attainment” under the annual fine particle (PM2.5) National Ambient Air Quality Standard (NAAQS). Among those non-attainment areas is the Philadelphia-Wilmington, PA-NJ-DE Non-Attainment Area (NAA). This NAA includes one county in Delaware, five counties in southeastern Pennsylvania, and three counties in New Jersey.1 According to the federal Clean Air Act (CCA) and the EPA Implementation Rule2, this entire NAA must attain compliance with the annual PM2.5 NAAQS by 2010.
Particle pollution, especially fine particles, contains microscopic solids or liquid droplets that are so small that they can get deep into the lungs and cause serious health problems. Numerous scientific studies have linked particle pollution exposure to a variety of problems, including:
People with heart or lung diseases, children and older adults are the most likely to be affected by exposure to particle pollution. However, even healthy individuals may experience temporary symptoms from exposure to elevated levels of particle pollution.
In addition to these public health impacts, fine particles are the major cause of reduced visibility in parts of the United States, including many of our treasured national parks and wilderness areas. Also, particles are transported over long distances by wind and then settle on the ground or water. The effects of this settling include making lakes and streams acidic, changing the nutrient balance in coastal waters and large river basins, depleting the nutrients in soil, damaging sensitive forests and farm crops, and affecting the diversity of ecosystems.
In response to the April 2005 non-attainment designation Delaware has developed this State Implementation Plan (SIP) revision. This SIP:
Acronym List
AQMS - Air Quality Management Section of DNREC
BOTW - Beyond-on-the-way
CAAA - Clean Air Act Amendments of 1990
CAIR - Clean Air Interstate Rule
CMSA - Consolidated Metropolitan Statistical Area
DelDOT - Delaware Department of Transportation
DNREC - Delaware Department of Natural Resources and Environmental Control
DOE - US Department of Energy
EGAS - Economic Growth Analysis System
EGU - Electric Generating Unit
EIA - Energy Information Administration
EID - Emission Inventory Development Program of AQMS
EPA - United States Environmental Protection Agency
I/M - Inspection and Maintenance Program
IPM - Integrated Planning Model
MANE_VU - Mid-Atlantic and Northeast Visibility Union
MARAMA - Mid-Atlantic Regional Air Management Association
NESCUAM - Northeast States for Coordinated Air Use Management
MPO - Metropolitan Planning Organization
mmBTU - Million British Thermal Unit
NAA - Non-Attainment Area
NAAQS - National Ambient Air Quality Standard
NEI - National Emission Inventory
NIF - National emission inventory Input Format
NLEV - National Low Emission Vehicle
NOx - Oxides of Nitrogen
OTB - On-the-book
OTW - On-the-way
PM2.5 - Particulate Matter with an aerodynamic diameter of 2.5 microns or less
PM10 - Particulate Matter with an aerodynamic diameter of 10 microns or less
POTW - Publicly Owned Treatment Works
QA-QC - Quality Assurance-Quality Control
RACM - Reasonably Available Control Measure
RACT - Reasonably Available Control Technology
RFP - Reasonable Further Progress
RPO - Regional Planning Organization
RRF - Relative Response Factor
RVP - Reid Vapor Pressure
SANDWICH - Sulfate, Adjusted Nitrate, Derived Water, Inferred Carbonaceous Material Balance
SCC - Source Classification Code
SIC - Standard Industrial Classification
SIP - State Implementation Plan
SMOKE - Sparse Matrix Operator Kernel Emissions (SMOKE) Modeling System
SO2 - Sulfur Dioxide
TIP - Transportation Improvement Program
TSD - Technical Supporting Document
VMT - Vehicle Miles Traveled
VOC - Volatile Organic Compound
List of Tables
Table 2- Delaware's PM2.5 Monitoring Site General Information
Table 2-2 Delaware's PM2.5 Monitor Site Specific Information
Table 2-3 Delaware Monitors - Three-year PM2.5 average of annual averages
Table 2-4 Delaware Monitors - Three-year PM2.5 average 98th percentiles
Table 2-5 Annual Average PM2.5 Concentrations, All Sites
Table 2-6 98th Percentiles
Table 2-7 PM2.5 Speciation - Annual average component mass, ug/m3
Table 2-8 PM2.5 Speciation - Annual average as percent of total mass
Table 2-9 Philadelphia CMSA estimated design values (three-year averages), excluding Delaware
Table 3-1 2002 PM2.5 and Precursor Emissions by County
Table 3-2 2002 Statewide Emissions by Source Sector
Table 3-3 2002 New Castle County Emissions by Source Sector
Table 3-4 Point Source Facilities in Delaware 2002 Base Year Inventory
Table 3-5 Non-Point Sources in Delaware 2002 Base Year Inventory
Table 3-6 Summary of 2002 Statewide Emissions from Non-point Sources
Table 3-7 Summary of 2002 Non-point Emissions for New Castle County
Table 3-8 2002 Annual Emissions and VMT for On-road Mobile Sources by County
Table 3-9 2002 Annual PM Exhaust, Brake Wear, and Tire Wear Emissions by County
Table 3-10 2002 Statewide Annual Emissions and VMT for On-road Mobile Sources by Vehicle Type
Table 3-11 2002 Statewide Emissions from Non-road Sources
Table 3-12 2002 Statewide Annual Emissions for NONROAD Equipment
Table 3-13 2002 Emissions for Natural Sources by County
Table 4-1 EGU emission projections calculated by the Integrated Planning Model (IPM)
Table 4-2 2009 EGU emissions - Delaware calculated
Table 4-3 Facility and Unit shutdowns
Table 4-4 Emission Reduction Credits and Holding Facilities/Agency
Table 4-5 Summary of the MACTEC 2009 Non-EGU Point Source Projection
Table 4-6 Summary of the Un-Revised Portion of the MACTEC 2009 Non-EGU Point Source
Projection
Table 4-7 Summary of the Revised Portion of the MACTEC 2009 Non-EGU Point Source Projection
Table 4-8 Summary of the Delaware Non-EGU Point Source Projection
Table 4-9 Summary of Delaware 2009 EGUs and non-EGUs Point Source Projection
Table 4-10 Summary of the MACTEC 2009 Non-Point Source Projection
Table 4-11 Summary of the Un-Revised Portion of the MACTEC 2009 Non-Point Source Projection
Table 4-12 Summary of the Revised Portion of the MACTEC 2009 Non-Point Source Projection
Table 4-13 Summary of the Delaware Non-Point Source Projections
Table 4-14 Summary of the MACTEC 2009 Non-Road Mobile Source Projection
Table 4-15 Summary of the Un-Revised Portion of the MACTEC 2009 Non-Road Mobile Source
Projection
Table 4-16 Summary of the Revised Portion of the MACTEC 2009 Non-Road Mobile Source
Projection
Table 4-17 Summary of the Delaware Non-Road Mobile Source Projection
Table 4-18 (NESCAUM/NY) 2009 Mobile Projections
Table 4-19 Delaware 2009 Mobile projections using the most up-to-date VMT and speeds
Table 4-20 2009 projections - all sectors - MANEVU
Table 4-21 2009 projections - all sectors - Delaware
Table 5-1 CMAQ Modeled 2009 Emissions, i.e. Attainment Targets
Table 5-2 DE Projected 2009 Emissions (Control Strategy Emissions)
Table 5-3 Attainment Demonstration (CMAQ Modeled 2009 Emissions minus DE Projected 2009
Emissions)
Table 5-4 SO2 "surplus/shortfall"
Table 6-1 PA-NJ-DE Designations for the PM2.5 NAAQS
Table 6-2 EPA PM2.5 Modeling Performance Goals
Table 6-3 MANE-VU PM2.5 Modeling Performance Goals
Table 6-4 Annual SMAT Results for PA-NJ-DE Nonattainment Area 2009 On-The-Books-On-The-
Way Control Measures
Table 6-5: 24-Hour Modeling Attainment Test Using EPA SMAT Methodology 2009 On-The-Books/
On-The-Way Control Measures
Table 7-1 DE 2002 and Projected 2009 Emissions
Table 7-2 CMAQ Modeled 2009 Emissions, Delaware
Table 7-3 2009 Statewide Emission Reductions attributable to Delaware Reg. 1146 (TPY)
Table 7-4 2009 Emissions Projection, Conservatively Low Estimate
Table 7-5 Delaware SO2 Emissions, Source Categories Covering 95% of Total Emissions
Table 8-1 On-Road Mobile primary and Precursor PM2.5 Emissions as a Percent of Total Projected
Inventory New Castle County
Table 8-2 On-Road Mobile Source Emission Projections for 2009Tons/Year
Table 9-1 Attainment Targets
Table 9-2 Delaware 2002 Base Year
Table 9-3 Contingency Requirement
Table 9-4 Delaware 2009 Projection
Table 9-5 Contingency - SO2 "surplus and shortfalls"
List of Figures
Figure 1-1 Philadelphia-Wilmington, PA-DE-NJ Non-attainment Area
Figure 2-1 Delaware's PM2.5 Monitoring Site Locations
Figure 2-2 Annual Average PM2.5 Concentrations, All Sites
Figure 2-3 Design value - 3-year average of annual average PM2.5 Concentrations
Figure 2-4 98th Percentile Trends
Figure 2-6 Three-year average 98th percentile - design values
Figure 2-7 2006 Annual Average Concentrations, Percent of Total Mass
Figure 2-8 Major component trends
Figure 2-9 Seasonal Components of PM2.5
Figure 2-10 Estimated design values for Philadelphia CMSA monitors
Figure 3-1 PM2.5 Emissions by County
Figure 3-2 SO2 Emissions by County
Figure 3-3 NOx Emissions by County
Figure 3-4 NH3 Emissions by County
Figure 3-5 PM2.5 Emissions by Source Sector
Figure 3-6 SO2 Emissions by Source Sector
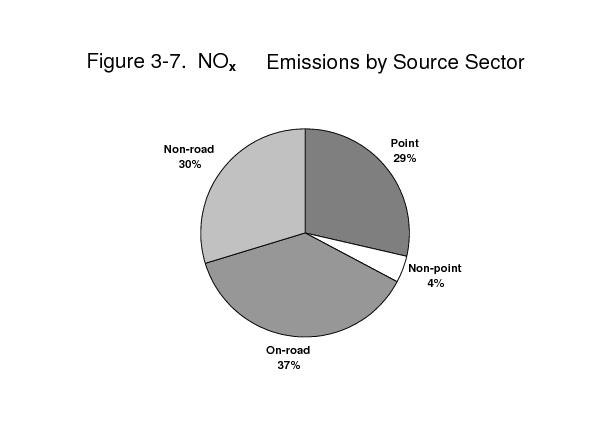
Figure 3-7 NOx Emissions by Source Sector
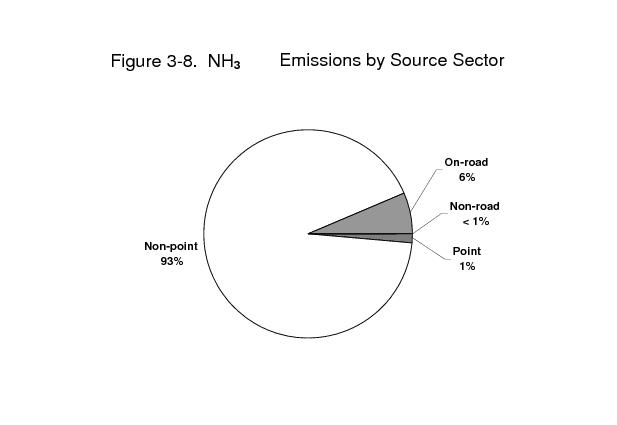
Figure 3-8 NH3 Emissions by Source Sector
Figure 6-1 The Philadelphia-Wilmington (PA-NJ-DE) nonattainment area
Figure 6-2 PM2.5 Modeling Domains at 36- and 12-km for the OTR
Figure 6-3 FRM Locations Used for the Model Evaluation Across the OTR+ Region
Figure 6-4 Composite FRM Time Series across the OTR+ Region (264 monitors)
Figure 6-5 MFE and MFB Time Series for FRM PM2.5 across the OTR+ Region
Figure 6-6 MFE Bugle Plot for FRM PM2.5 across OTR+ Region
Figure 6-7 MFE Bugle Plot for SO4 across OTR+ Region
Figure 6-8 MFE Bugle Plot for NO3 SO4 across OTR+ Region
Figure 6-9 MFE Bugle Plot for NH4 across OTR+ Region
Figure 6-10 MFE Bugle Plot for EC across OTR+ Region
Figure 6-11 MFE Bugle Plot for OM across OTR+ Region
Figure 6-12 MFE Bugle Plot for Soil/Crustal across OTR+ Region
Figure 6-13 Empirical variogram fitted with different models for the annual standard
Figure 6-14 Map of kriging estimates for the annual standard fitted with weighted least squares model
and nugget set to 0.15
Figure 6-15 Empirical variogram fitted with different models for the daily standard
Figure 6-16 Map of kriging estimates for the daily standard fitted with weighted least squares model
and nugget set to 0.15
Figure 6-17 Trend in Annual PM2.5 Design Values (2000 through 2006)
Figure 6-18 Trend in Daily PM2.5 Design Values (2000 through 2006)
List of Appendices
A collection of the listed appendixes, stored on CD, is available upon request. Contact Delaware's Air Quality Management Section at 156 South State Street, Dover, DE 19901.
Appendix 4-1 Development of Emission Projections for 2009, 2012, and 2018 for Non-EGU Point, Area, and Non-road Sources in the MANE-VU Region, Draft Final Technical Support Document, Prepared for Mid-Atlantic Regional Air Management Association (MARAMA) by MACTEC Federal Programs, Inc., December 7, 2006.
Appendix 4-2 The 2009 Corrected Emission Projections of Delaware EGU, Non-EGU, Non-Point and Non-Road Mobile Sources.
Appendix 4-3 The 2009 Emission Projections for Delaware's Point, Non-Point, Onroad, and Non-Road Mobile Sources.
Appendix 4-4 Part 1: MOBILE6.2 Input and Output Files for Delaware 2009 Mobile Source Emission
Part 2: Calculations of 2008 and 2009 On-Road Mobile Source Emission Projections
Appendix 6-1 The Nature of the Fine Particle and Regional Haze Air Quality Problems in the MANE-VU Region: A Conceptual Description (NESCAUM, November 2006) and
Appendix 6-2 The Development of PM2.5 Forecasting Tools for Selected Cities in the MARAMA Region (ICF, September 2004)
Appendix 6-3 The New York State DEC, Division of Air Resources, performance evaluation of the 2002 base case CMAQ simulation
Appendix 6-4/a SANDWICH Method
Appendix 7-1 EPA List of Control Measures
Appendix 8-1 Example 2009 Mobile Emission Projection Calculations
On July 18, 1997 the US Environmental Protection Agency (EPA) established a health based fine particulate matter (PM2.5) National Ambient Air Quality Standard (NAAQS) at 15.0 micrograms per cubic meter (µg/m3), annual average.3 New Castle County, Delaware was designated by the EPA as being in non-attainment for this annual PM2.5 NAAQS in April 20054. Kent and Sussex Counties were designated as attainment; however, sources within these counties emit PM2.5 and PM2.5 precursors which contribute to PM2.5 non-attainment in New Castle County.This document contains Delaware’s State Implementation Plan (SIP) revision for meeting attainment of the annual PM2.5 NAAQS, and is hereafter referred to as “Delaware’s PM2.5 SIP revision,” or simply as “the PM2.5 SIP.”
1.1 Purpose of this document
Once an area is designated as non-attainment, the Clean Air Act (CAA) requires that area to, within three years of the designation effective date, submit to the EPA a SIP which demonstrates how that area will attain compliance with the NAAQS. This SIP is due to the EPA in April 2008, and attainment of the annual PM2.5 NAAQS must be demonstrated by 2010.
On March 30, 2007, the EPA finalized a PM2.5 Implementation Rule (hereafter referred to as the “Rule”), which sets forth the requirements that SIPs must meet to satisfy CAA requirements. The Rule requires:
This document demonstrates that all of the CAA and Rule requirements associated with the annual PM2.5 NAAQS have been met; and that Delaware and the entire Philadelphia-Wilmington-DE-PA-NJ non-attainment area will attain compliance with the annual PM2.5 NAAQS as expeditiously as practicable, and not later than 2010.
1.2 What is PM2.5?
PM2.5 is defined as those particles with a nominal aerodynamic diameter of two and one half (2½) micrometers or less. PM2.5 is composed of a complex mixture of particles: sulfate (SO4), nitrate (NO3) and ammonium (NH4) particles; particle-bound water; black carbon (also known as elemental carbon); a great variety of organic compounds (or VOCs); and crustal materials. PM2.5 is broadly categorized as primary PM2.5 and secondary PM2.5:
Primary fine particles include soot from diesel engines, a wide variety of organic compounds condensed from incomplete combustion or cooking operations, and compounds such as arsenic, selenium, and zinc that condense from vapor formed during combustion or smelting. The metals are a subset of crustal materials. The concentration of primary PM2.5 in the air depends on source emission rates, transport and dispersion, and removal rate from the atmosphere. Primary PM2.5 is considered the "local" component of Delaware's PM2.5 problem, meaning that it is the portion of the PM2.5 levels produced locally that contribute to monitored violations of the standard in Delaware.
Secondary PM2.5 formation depends on numerous factors including the concentrations of precursors and other gaseous reactive species such as ozone, hydroxyl radicals, peroxy radicals, or hydrogen peroxide. Contributing atmospheric conditions include solar radiation and relative humidity, along with the interactions of the precursors and pre-existing particles with cloud or fog droplets or in the liquid film on solid particles. Depending on the PM2.5 precursor, they can have either a "local" or "regional" impact, or some combination, on PM2.5 concentrations. A regional impact means that the emissions produced locally form secondary PM2.5 emissions over time as they are transported through the atmosphere, and by the time those secondary particles are fully formed, they no longer contribute to the monitored violations of the standard in the State where the precursors were initially emitted. However, they will have an impact on the monitored violations in other states downwind.
1.3 Health effects and welfare impacts of PM2.5.
The PM2.5 NAAQS were established by the EPA based on evidence from numerous health studies demonstrating that serious health effects are associated with exposure to elevated levels of PM2.5. Epidemiological studies have shown statistically significant correlations between elevated PM2.5 levels and premature mortality. Other important effects associated with PM2.5 exposure include aggravation of respiratory and cardiovascular diseases (as indicated by increased hospital admissions, emergency room visits, absences from school or work, and restricted activity days), changes in lung function and increased respiratory symptoms, as well as new evidence for more subtle indicators of cardiovascular health. Individuals particularly sensitive to PM2.5 exposure include older adults, people with heart and lung disease, and children.
Even small reductions in PM2.5 levels have been demonstrated to yield substantial health benefits on a population level. For example, in a moderate-sized metropolitan area with a design value of 15.5 ug/m3, efforts to improve annual average air quality down to the level of the standard (15.0 ug/m3) are estimated to result in as many as 25-50 fewer mortalities per year due to air pollution exposure. In a smaller city, the same air quality improvements from 15.5 to 15.0 ug/m3 are estimated to result in a number of avoided mortalities per year.
In both 1997 and 2006 EPA established welfare-based (secondary) standards identical to the levels of the primary standards. The secondary standards are designed to protect against major environmental effects of PM2.5 such as visibility impairment, crop damage, soil and water quality impacts from deposition, and materials damage.
1.4 Emissions Addressed in this SIP: Direct PM2.5 and Precursors.
The Rule requires non-attainment areas to evaluate and consider, at a minimum, control strategies for sources of direct PM2.5 emissions, and for sources of the precursor sulfur dioxide (SO2). As such, both of these two pollutants are regulated pollutants under this SIP. In addition, consistent with EPA presumption in the Rule, and as explained in subsections 1.4.1 through 1.4.3 below, nitrogen oxide (NOX) is also a regulated pollutant under this SIP, while volatile organic compounds (VOC) and ammonia (NH3) are not5.
1.4.1 Nitrogen Oxides (NOX).
For the precursor NOX the Rule makes the presumption that NOX emission must be addressed in the SIP, and that this presumption is valid unless a technical demonstration to the contrary is made by the State or EPA. Consistent with the Rule presumption, and because nitrates make up a significant percentage of PM2.5 concentrations in Delaware (see Section 2 of this Document for a detailed discussion), NOX is specifically addressed in this SIP, and is a regulated pollutant under this SIP.
1.4.2. Volatile Organic Compounds (VOC).
For the precursor VOC, the Rule presumptively requires that VOC emissions do not need to be regulated pollutants under this SIP. This presumption is valid unless a technical demonstration to the contrary is made by the State or EPA. The organic component of ambient particles is a complex mixture of hundreds or even thousands of organic compounds. These organic compounds are either emitted directly from sources (i.e., primary organic aerosol) or are formed by reactions in the ambient air (i.e., secondary organic aerosol, or SOA). VOCs are key precursors in the formation processes for both SOA and ozone. The relative importance of organic compounds in the formation of secondary organic particles varies from area to area, depending upon factors such as local emissions sources, atmospheric chemistry, and the season of the year.
Despite significant advances in understanding the origins and properties of SOA, it remains probably the least understood component of PM2.5. The reactions forming secondary organics are complex, and the number of intermediate and final compounds formed is voluminous. Some of the best efforts to unravel the chemical composition of ambient organic aerosol matter have been able to quantify the concentrations of hundreds of organic compounds representing only 10–20 percent of the total organic aerosol mass. For this reason, SOA continues to be a significant topic of research and investigation.
Current scientific and technical information clearly shows that carbonaceous material is a significant fraction of total PM2.5 mass in most areas, that certain VOC emissions are precursors to the formation of SOA, and that a considerable fraction of the total carbonaceous material is likely from local as opposed to regional sources. However, while significant progress has been made in understanding the role of gaseous organic material in the formation of organic particulate matter, this relationship remains complex. The Department recognizes that further research and technical tools are needed to better characterize emissions inventories for specific VOC compounds, and to determine the extent of the contribution of specific VOC compounds to organic particulate matter mass.
In light of these factors Delaware is not regulating VOC emissions as PM2.5 precursors under this SIP. However, since all of Delaware is currently designated as being in non-attainment for the 8-hour ozone NAAQS, and since VOC emissions are a precursor regulated under the 8-hour ozone NAAQS, emission control measures for VOCs that have and are being implemented throughout the state will provide a PM2.5 benefit.
1.4.3 Ammonia (NH3).
The Rule presumptively requires that ammonia emissions do not need to be addressed as a PM2.5 precursor. This presumption is valid unless a technical demonstration to the contrary is made by the State or EPA.
Ammonia (NH3) is a gaseous pollutant that is emitted by natural and anthropogenic sources. Ammonia serves an important role in neutralizing acids in clouds, precipitation and particles. In particular, ammonia neutralizes sulfuric acid and nitric acid, the two key contributors to acid deposition (acid rain). However, despite this benefit, deposited ammonia contributes to problems of eutrophication in water bodies, and deposition of ammonium particles may effectively result in acidification of soil as ammonia is taken up by plants. The NARSTO Fine Particle Assessment6 indicates that reducing ammonia emissions where sulfate concentrations are high may reduce PM2.5 mass concentrations, but may also increase the acidity of particles and precipitation. An increase in particle acidity is suspected to be linked with human health effects and with an increase in the formation of secondary organic compounds.
Based on the above information, and further insights gained from the NARSTO Fine Particle Assessment, it is apparent that the role of ammonia emissions in the formation of particles is complex and nonlinear. Though recent studies have improved our understanding of the role of ammonia in aerosol formation, ongoing research is required to better determine the relationships between ammonia emissions and particulate matter concentrations. Techniques and analytical tools to quantify the impact of reducing ammonia emissions on atmospheric aerosol formation are evolving. Area-specific data is needed to evaluate the effectiveness of reducing ammonia emissions on lowering the PM2.5 concentrations in different areas, and to determine where ammonia reduction may increase the acidity of particles and precipitation.
Also, emissions inventories for ammonia are considered to be among the most uncertain of any species related to PM. This further complicates the task of assessing the potential impacts of ammonia emissions reductions on particulate matter concentrations.In addition, data necessary to understand the atmospheric composition and balance of ammonia and nitric acid in an area are not widely available across PM2.5 non-attainment areas, making it difficult to predict the results of potential ammonia emission reductions. Ammonia reductions may be effective and appropriate for reducing PM2.5 concentrations in selected locations, but in other locations such reductions may lead to minimal reductions in PM2.5 concentrations and increased atmospheric acidity.
Because ammonia emission inventories and the other “tools” discussed above need much more refinement, Delaware is not regulating ammonia as a PM2.5 precursor under this SIP.
1.5 Identification of Non-attainment Areas.
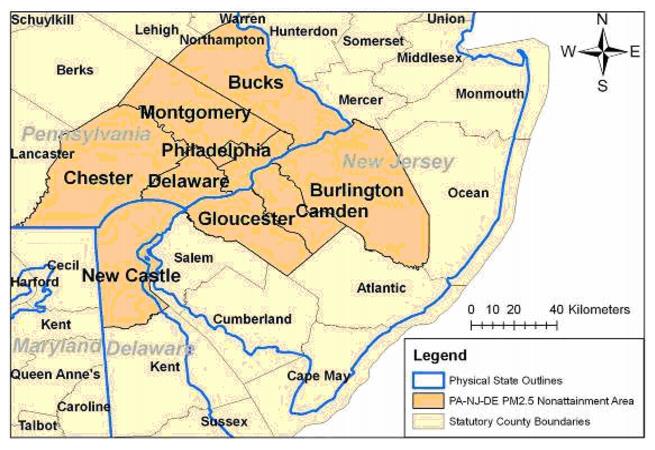
Effective April 5, 2005 the EPA designated 47 areas, composed of 224 counties and the District of Columbia as “non-attainment” under the PM2.5 annual NAAQS (70 FR 944, January 5, 2005). Among those non-attainment areas is the Philadelphia-Wilmington-PA-DE-NJ Non-Attainment Area (NAA) that includes one county in Delaware, five counties in southeastern Pennsylvania and three counties in New Jersey, as shown in Figure 1-1. Since the NAA is centered on Philadelphia, it is referred to as “Philadelphia NAA.” According to the CAA, the entire Philadelphia NAA must attain the PM2.5 annual NAAQS as expeditiously as practicable, and not later than 2010.
Figure 1-1. Philadelphia-Wilmington, PA-DE-NJ Non-attainment Area
1.6 Responsibilities.
The agency with direct responsibility for preparing and submitting this document is Delaware Department of Natural Resources and Environmental Control (DNREC), Division of Air and Waste Management, Air Quality Management Section (AQMS), under the Section Administrator, Ali Mirzakhalili, P.E. The working responsibility for Delaware’s air quality planning falls within AQM’s Planning Branch, under the Program Manager, Ronald Amirikian. The Planning Branch is instrumental in completing this document. Specifically,
Specific responsibilities of other programs, agencies and contractors are discussed in the relevant sections of this document.
2.1 Delaware PM2.5 Federal Reference Method (FRM) Monitoring Network.
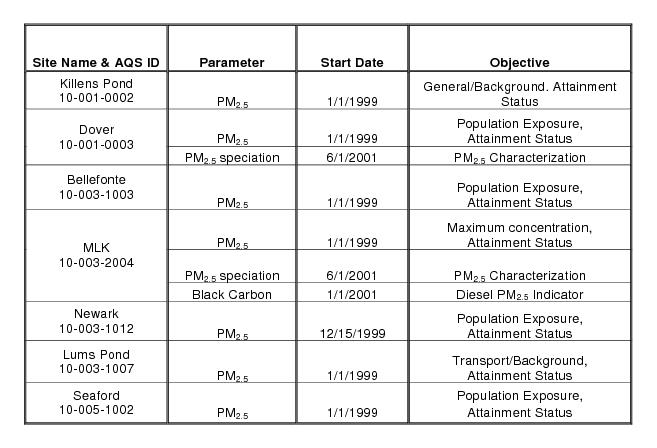
Delaware began official PM2.5 monitoring in 1999. Delaware’s PM2.5 network consists of seven (7) monitoring sites, one of which employs a collocated monitor. There are four (4) sites in New Castle County, two (2) in Kent County and one (1) in Sussex County. Table 2.1 lists the PM2.5 sites in Delaware, including the nature of the area, and general site descriptions. Table 2.2 contains more specific information for each PM2.5 monitoring site.
The primary goal of the PM2.5 monitoring network in Delaware is to determine the status of the ambient air with respect to the 24-hour and annual average PM2.5 NAAQS. In accordance with federal regulations, state agencies must operate at least the minimum number of required PM2.5 sites listed in 40 CFR Part 58 Appendix D Table D-5. These required monitoring stations or sites must be sited to represent community-wide air quality. In addition, the following specific criteria also apply:
(1) At least one monitoring station is to be sited in a population-oriented area of expected maximum concentration.
(2) For areas with more than one required station, a monitoring station is to be sited in an area of poor air quality.
(3) Each State shall install and operate at least one PM2.5 site to monitor for regional background and at least one PM2.5 site to monitor regional transport.
Figure 2.1 shows the locations of Delaware’s PM2.5 monitors. All data from these monitors is measured using U.S. EPA approved federal reference methods. All PM2.5 sites are sited appropriately and are eligible for comparison to the annual NAAQS of 15.0 ug/m3.
The standard monitoring schedule is one in three days, with one site (MLK-Wilmington) monitoring every day. MLK is also the designated collocated site, with the collocated monitor designated as MLK-b operating on a one in six day schedule. All data is submitted to EPA’s Air Quality System (AQS) in a timely manner in accordance to the schedule prescribed by EPA.
Chemical speciation is encouraged at sites where the chemically resolved data would be useful in developing State implementation plans and supporting atmospheric or health effects related studies. These sites in Delaware are MLK in Wilmington and Dover in Kent County. The PM2.5 chemical speciation sites include analysis for elements, selected anions and cations, and carbon.
Figure 2.1 Delaware’s PM2.5 Monitoring Site Locations

Table 2.1 Delaware’s PM2.5 Monitoring Site General Information
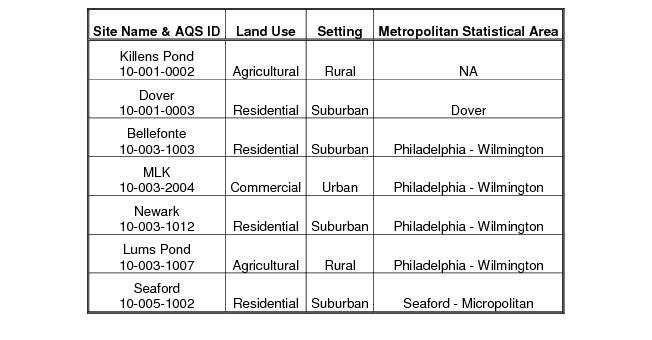
Table 2.2 Delaware’s PM2.5 Monitor Site Specific Information
2.2 Delaware PM2.5 Design Values.
Under the PM2.5 annual average NAAQS, Delaware’s New Castle County was designated as a non-attainment area based on its three-year annual average data (2001 – 2003). New Castle County is also considered part of the greater Philadelphia CMSA which has been designated non-attainment for PM2.5. 7
Table 2.3 shows the three-year average of the annual average PM2.5 concentration for each monitoring site in all three counties in Delaware from 1999 through 2006. This is the value that is comparable to the annual average NAAQS and is referred to as the Design Value.
Table 2.3 Delaware Monitors - Three-year PM2.5 average of annual averages

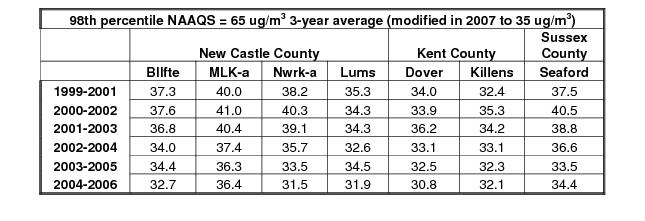
Table 2.4 shows the three-year average of the annual 98th percentiles for each monitoring site, which is the value that is comparable to the 98th percentile NAAQS.
Table 2.4 Delaware Monitors - Three-year PM2.5 average 98th percentiles
2.3 Ambient PM2.5 Concentration Trends.
2.3.1 Annual Averages
The annual average concentration is calculated from the four calendar quarterly averages at each monitoring site. This annual average is the basic statistic used in determining trends and compliance with the annual average NAAQS.
Table 2.5 shows the annual average PM2.5 concentration at each monitoring site. Figure 2.2 is a graph of that same data, which shows trends over the eight years of monitoring that have been conducted.
Table 2.5 Annual Average PM2.5 Concentrations, All Sites

Figure 2.2 Annual Average PM2.5 Concentrations, All Sites
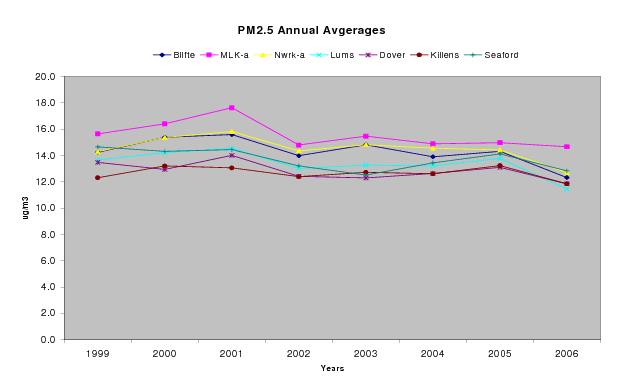
Using the 3-year average of the annual averages, the trend in annual PM2.5 NAAQS compliance is seen in Figure 2.3.
Figure 2.3 Design value – 3-year average of annual average PM2.5 Concentrations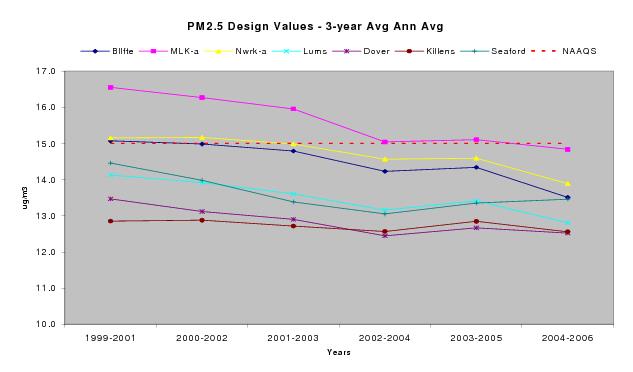
2.3.2 98th Percentile NAAQS
The 98th percentile value is calculated from the total number of daily samples in a calendar year. Table 2.6 shows the 98th percentile value for each monitoring site for each year.
Table 2.6 98th Percentiles
98th percentiles | |||||||
New Castle County | Kent County | Sussex County | |||||
Bllfte | MLK-a | Nwrk-a | Lums | Dover | Killens | Seaford | |
1999 | 33.1 | 37.5 | 35.4 | 33.5 | 36.0 | 28.5 | 35.0 |
2000 | 38.2 | 39.3 | 39.8 | 36.4 | 27.8 | 34.4 | 36.0 |
2001 | 40.7 | 43.2 | 39.5 | 35.9 | 38.3 | 34.4 | 41.6 |
2002 | 33.8 | 40.6 | 41.5 | 30.6 | 35.5 | 37.1 | 44.0 |
2003 | 35.8 | 37.4 | 36.4 | 36.5 | 34.9 | 31.2 | 30.7 |
2004 | 32.5 | 34.1 | 29.1 | 30.8 | 28.9 | 31.0 | 35.1 |
2005 | 34.8 | 37.4 | 35.0 | 36.2 | 33.6 | 34.6 | 34.7 |
2006 | 30.9 | 37.7 | 30.5 | 28.8 | 29.9 | 30.7 | 33.3 |
Figure 2.4 shows the data that was presented in Table2.6 in graphic format.
Figure 2.4 98th Percentile Trends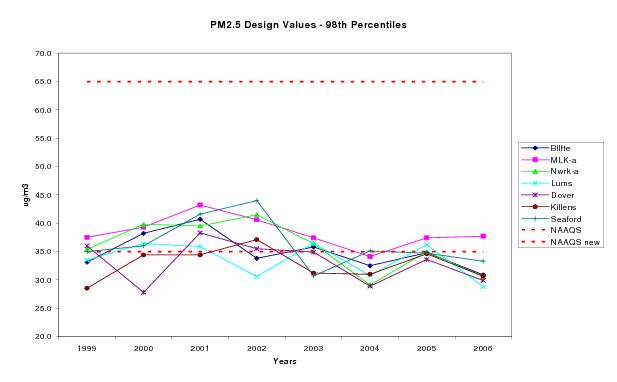
The 98th percentile NAAQS is a 3-year average concentration.The original PM2.5 NAAQS promulgated in 1999 was 65 ug/m3. All monitoring sites in Delaware indicate compliance with this NAAQS. As indicted in Section 1 of this document, in December 2006 this NAAQS was revised from 65 ug/m3 down to 35 ug/m3. Figure 2.6 shows the trends in the 3-year average 98th percentile values for each monitoring site in Delaware. The most recent 3-year average shows the MLK site in Wilmington exceeds the 98th percentile NAAQS. 8
Figure 2.6 Three-year average 98th percentile - design values
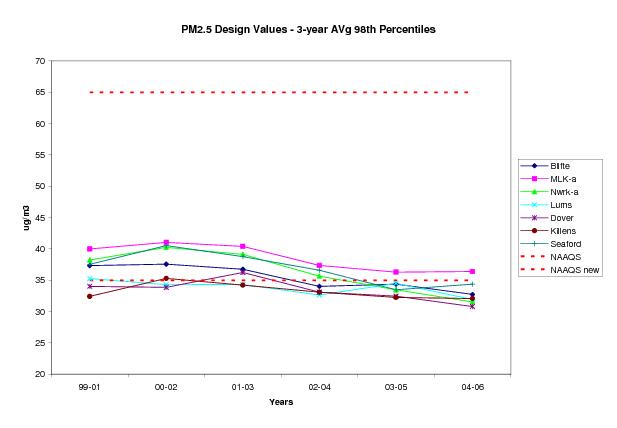
Using a 3-year average value smoothes out some of the year to year variability of the daily concentrations and can make trends easier to detect. Figure 2.6 shows that Delaware’s monitors have generally decreasing concentrations since monitoring began in 1999. The most recent 3-year periods (2003–2005 and 2004–2006) may show a leveling off or slight increase in daily concentrations, but more data will be needed to determine the validity of this change.
2.4 Speciation Data.
When EPA revised and promulgated the standards for PM2.5 they also included regulatory requirements for monitoring the chemical composition or speciation of these particles. The monitors used for this purpose are referred to as speciation monitors.
The programmatic objectives of the speciation network are to:
The PM2.5 Speciation program incorporates National Speciation Trends Network (STN) sites as well as supplemental sites. The supplemental sites are State and Local Air Monitoring Sites (SLAMS) deployed by State, Local and Tribal agencies to allow flexibility in meeting local air monitoring needs. Both types of speciation sites are located primarily in urban areas with expected high PM2.5 concentrations, and a smaller number of sites located in more rural or transport areas. In Delaware, there are two supplemental SLAMS speciation sites: MLK and Dover.
The speciation samplers collect 24-hour integrated samples. The samplers use Teflon, nylon, and quartz filter media for the collection of target analytes. The Teflon filter is used to collect particles for the analysis of mass and metals composition, samples analyzed for carbon components of particles are collected on the quartz filters, and samples for ion analysis are collected on nylon filters.
The state/local agencies are responsible for siting and operations of the field monitors. Analysis of the samples for the target analytes is performed by a contract laboratory. All valid data from the speciation samplers is submitted to the national ambient air quality system (AQS) database.
2.4.1 PM2.5 Speciation Data
Delaware began the speciation monitoring in 2001, with the first full year of data being collected in 2002. The following tables show the results for Delaware’s PM2.5 speciation program from 2002 through 2006.
Table 2.7 PM2.5 Speciation – Annual average component mass, ug/m3
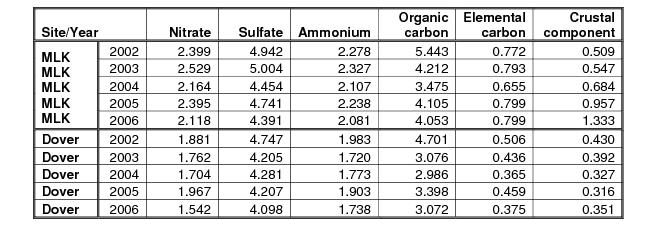
Table 2.8 PM2.5 Speciation – Annual average as percent of total mass
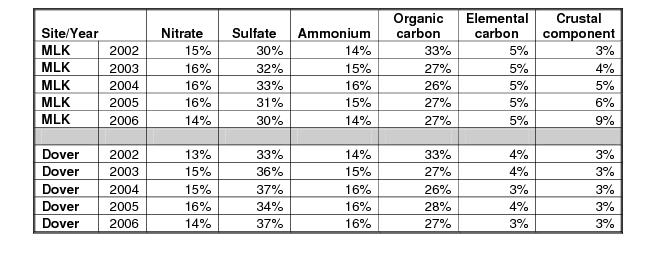
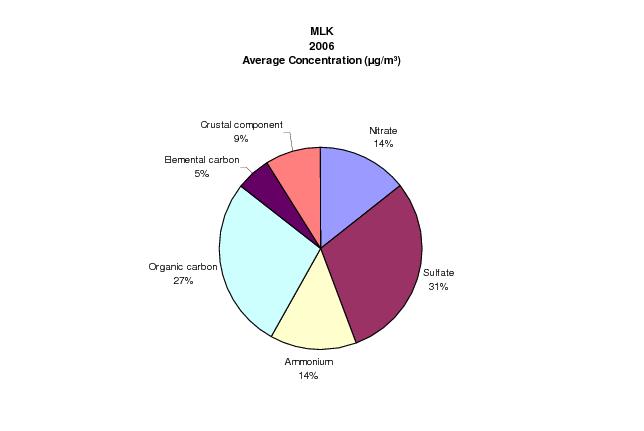
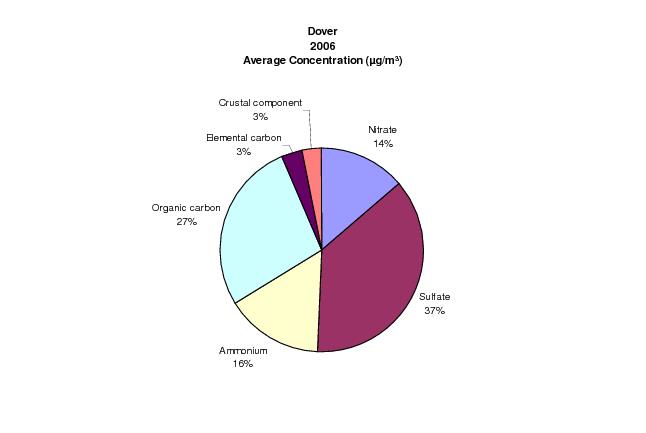
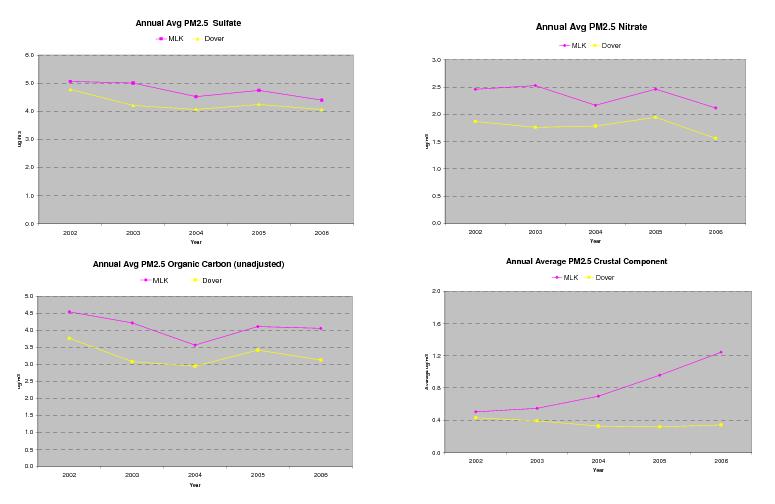
Most eastern US speciation sites are dominated by sulfate, which is also the dominant species at both MLK and Dover as shown in Figure 2.7. At MLK, the crustal component is elevated in 2006 due to nearby construction activities. Otherwise, annual component percentages of total mass are similar at both MLK and Dover.
Figure 2.7 2006 Annual Average Concentrations, Percent of Total Mass
2.4.2 Speciation trends and seasonal patterns
Trends in major components are shown in figure 2.8. Overall, there is a slight downward trend in sulfates, nitrates, and organic carbon at both MLK and Dover. There is an increase in the crustal component at MLK due to nearby construction.
Figure 2.8 Major component trends
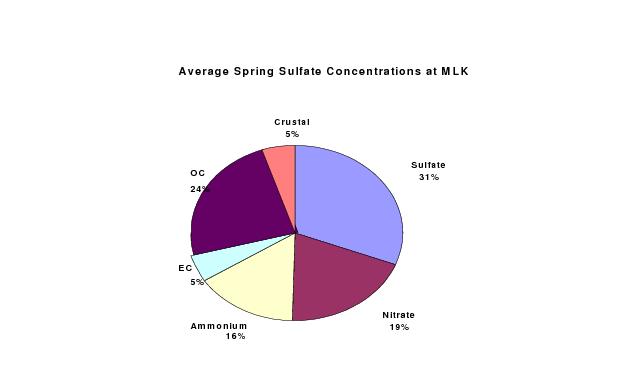
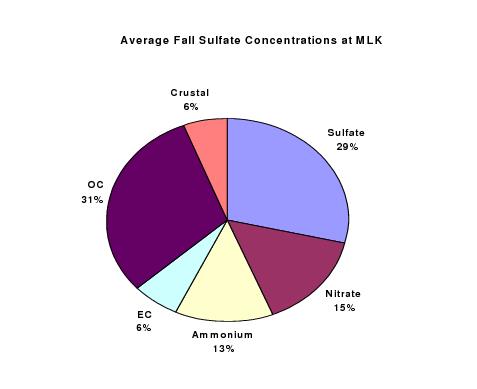
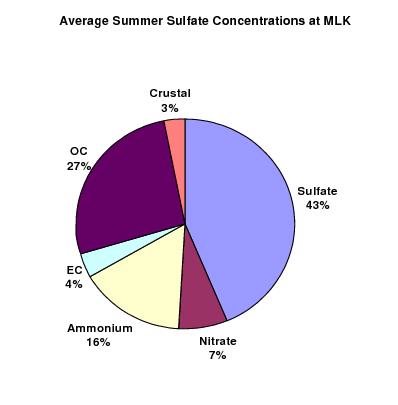
Seasonal patterns are also a characteristic of PM2.5 speciation data. As with most eastern US cities, sulfat is highest in the summer and nitrate is highest in the winter at both MLK and Dover. Organic carbon is highest in the summer and fairly constant in other seasons at both sites. In general, relative composition of PM2.5 is similar at both MLK and Dover. Seasonal average major components as percent total mass at the MLK monitor are presented in Figure 2.9.
Additional information and discussion on the major components and characteristics of PM2.5 is provided in Section 6-7 of this Document, which presents a conceptual model for the regional and local particulate matter sources.
Figure 2.9 Seasonal Components of PM2.5

2.5 Other monitors in the Philadelphia Non-attainment Area
As stated previously, Delaware is part of the Philadelphia based PM2.5 non-attainment area. To compare Delaware’s monitors with others in the CMSA, the estimated design values (three-year averages of the annual averages) were calculated using data from the national AQS database. The data was not adjusted for missing data, so the values listed are estimates only and not official design values. The three-year average design values were then plotted in Figure 2.10 for each individual monitor.
Table 2.9 Philadelphia CMSA estimated design values (three-year averages), excluding Delaware
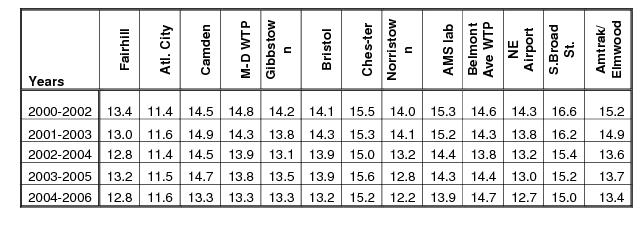
Figure 2.10 Estimated design values for Philadelphia CMSA monitors
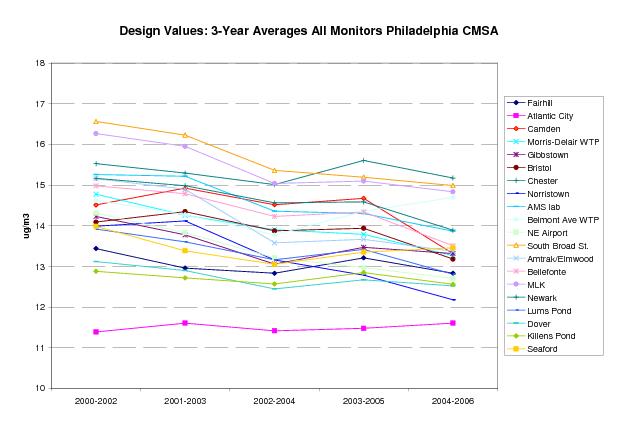
Note: Design values were calculated for each site regardless of data capture rate, and do not represent final or official design values and are shown for comparison purposes only.
3.1 2002 PM2.5 and Precursor Inventory Overview.
EPA established calendar year 2002 as the base year inventory for the PM2.5 standard. This requires states with PM2.5 non-attainment areas to submit to the EPA no later than three years after designation, as part of their State Implementation Plan (SIP), a statewide comprehensive, accurate, and current base year inventory of actual emissions of PM2.5 and its precursors.
This section summarizes Delaware’s 2002 statewide inventory of PM2.5 and PM2.5 precursors for all sources, which are categorized into the following five major source sectors: stationary point, stationary non-point, on-road mobile, non-road mobile, and natural. For additional information on methods, data collection and QA procedures, refer to 2002 Base Year State Implementation Plan Emissions Inventory for PM2.5 and Precursors, Delaware Department of Natural Resources and Environmental Control, Air Quality Management Section, Dover, Delaware, April 2007; hereafter referred to as the “2002 base year inventory.”
The parameters defined by the 2002 base year inventory included the following:
3.2 Emissions Summary.
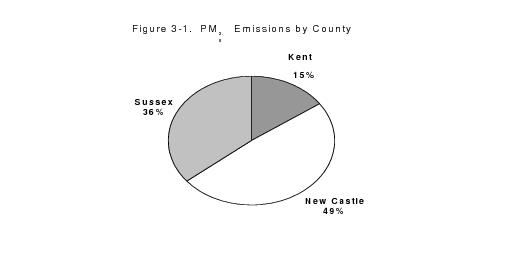
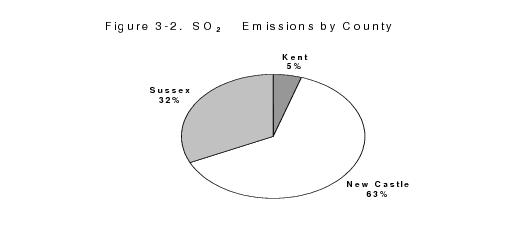
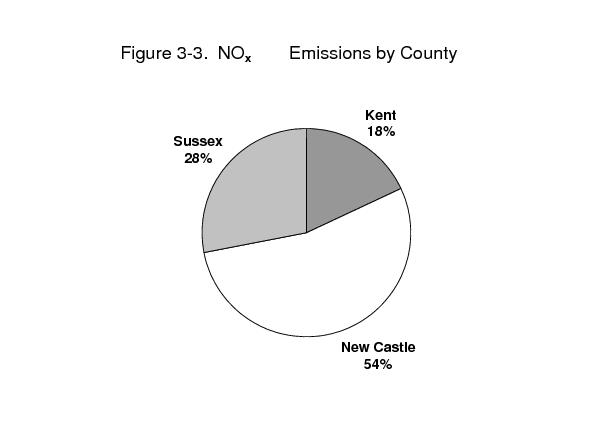
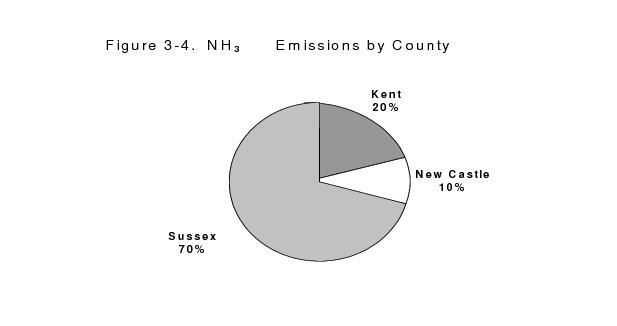
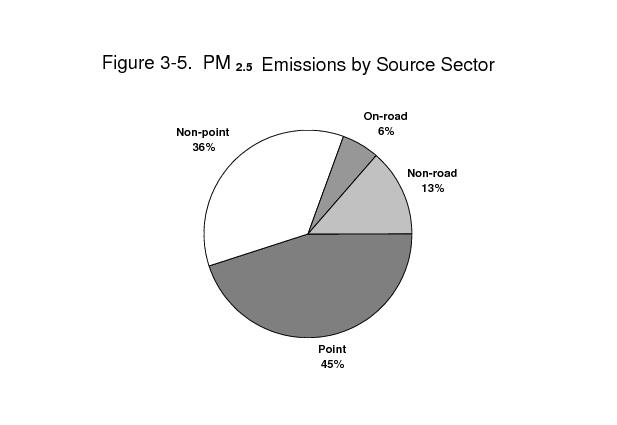
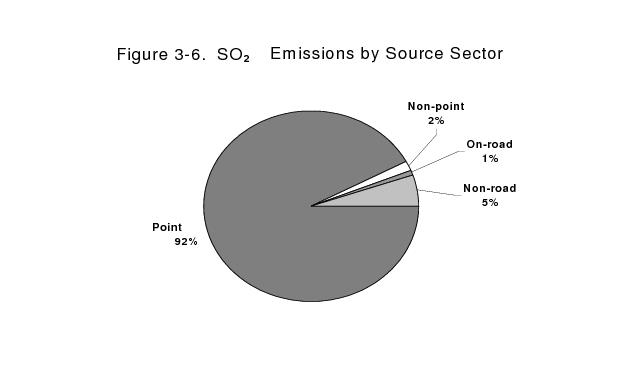
The following emission summaries present the entire 2002 emission inventory for PM10, PM2.5, SO2, NOx, NH3, and VOCs, broken down by county and source sector. Natural sources of emissions are presented separately from anthropogenic sources of emissions. Throughout this document, annual emissions are reported in tons per year (TPY).9
Table 3-1 2002 PM2.5 and Precursor Emissions by County

Table 3-2 2002 Statewide Emissions by Source Sector
Source Sector | Annual Emissions (TPY) | |||||
PM10 | PM2.5 | SO2 | NOx | NH3 | VOC | |
Point | 3,859 | 3,161 | 73,708 | 16,372 | 179 | 4,773 |
Non-point | 13,870 | 2,580 | 1,330 | 2,427 | 13,194 | 10,254 |
On-road | 581 | 415 | 584 | 21,341 | 903 | 10,564 |
Non-road | 1,043 | 946 | 4,230 | 16,982 | 8 | 8,019 |
All Sectors | 19,353 | 7,102 | 79,852 | 57,122 | 14,284 | 33,610 |
Table 3-3. 2002 New Castle County Emissions by Source Sector

3.3 Stationary Point Sources.
The point source inventory represents facility-specific data for Delaware’s larger stationary sources. Point sources typically include large industrial, commercial and institutional facilities. Manufacturing facilities, within the industrial sector, comprise the majority of all reporting point sources. The institutional sector includes hospitals, universities, prisons, military bases, landfills, and wastewater treatment plants. Table 3-4 presents a listing of Delaware’s 136 point sources.
Table 3-4 Point Source Facilities in Delaware 2002 Base Year Inventory
# | Facility Location | Facility ID | Facility Name |
1 | Kent County, DE | 1000100026 | BAYHEALTH MED CENTER KENT GENERAL HOSP |
2 |
| 1000100154 | BURRIS LOGISTICS HARRINGTON |
3 |
| 1000100099 | CAMDEL METALS CORPORATION |
4 |
| 1000100002 | CITY OF DOVER - MCKEE RUN GENERATING STA |
5 |
| 1000100076 | CITY OF DOVER VAN SANT GENERATING STA |
6 |
| 1000100121 | COLOR-BOX LLC |
7 |
| 1000100068 | DE SOLID WASTE AUTHORITY SANDTOWN |
8 |
| 1000100066 | DELAWARE STATE UNIVERSITY |
9 |
| 1000100001 | DOVER AIR FORCE BASE |
10 |
| 1000100016 | DOW REICHHOLD SPECIALTY LATEX LLC |
11 |
| 1000100024 | HANOVER FOODS CORPORATION |
12 |
| 1000100012 | HARRIS MANUFACTURING CO INC |
13 |
| 1000100067 | HIRSH INDUSTRIES |
14 |
| 1000100011 | ILC DOVER INC. |
15 |
| 1000100007 | KRAFT FOODS NORTH AMERICA |
16 |
| 1000100178 | LEHIGH VALLEY DAIRY |
17 |
| 1000100127 | NRG ENERGY CENTER DOVER LLC |
18 |
| 1000100075 | PERDUE FARMS INC - MILFORD |
19 |
| 1000100004 | PROCTOR AND GAMBLE DOVER WIPES COMPANY |
20 |
| 1000100157 | QUALITY KITCHEN CORP |
21 | 1000100006 | TILCON DELAWARE - BAY ROAD | |
22 |
| 1000100014 | TILCON DELAWARE - HORSEPOND ROAD |
23 |
| 1000100087 | TRAPPE PACKING CORPORATION |
24 |
| 1000100161 | UNITED STATES COLD STORAGE |
25 |
| 1000100152 | WARREN F BEASLEY POWER STATION |
26 | New Castle County, DE | 1000300377 | AGILENT TECHNOILOGIES |
27 |
| 1000300064 | AIR LIQUIDE AMERICA L P |
28 |
| 1000300131 | ALFRED I DUPONT HOSPITAL FOR CHILDREN |
29 |
| 1000300029 | AMETEK INC CHEMICAL PRODUCTS DIVISION |
30 |
| 1000300288 | AMI ASSET ACQUISITION CO |
31 |
| 1000300023 | AMTRAK WILMINGTON MAINTENANCE FACILITY |
32 |
| 1000300059 | ARLON, INC. |
33 |
| 1000300106 | ASTRAZENECA PHARMACEUTICALS LP-FAIRFAX |
34 |
| 1000300612 | BURRIS LOGISTICS - NEW CASTLE |
35 |
| 1000300080 | CHRISTIANA CARE - CHRISTIANA HOSPITAL |
36 |
| 1000300024 | CHRISTIANA CARE - WILMINGTON HOSPITAL |
37 |
| 1000300068 | CHRISTIANA MATERIALS |
38 |
| 1000300003 | CIBA SPECIALTY CHEMICALS CORP |
39 |
| 1000300063 | CLAYMONT STEEL |
40 |
| 1000300290 | CLEAN EARTH OF NEW CASTLE |
41 |
| 1000300317 | CONECTIV DELMARVA GENERATION-CHRISTIANA |
42 |
| 1000300005 | CONECTIV DELMARVA GENERATION-DEL CITY |
43 |
| 1000300007 | CONECTIV DELMARVA GENERATION-EDGE MOOR |
44 |
| 1000300388 | CONECTIV DELMARVA GENERATION-HAY ROAD |
45 |
| 1000300046 | CONECTIV DELMARVA GENERATION-MADISON ST |
46 |
| 1000300006 | CONECTIV DELMARVA GENERATION-WEST_SUBST |
47 |
| 1000300066 | CONTRACTORS MATERIALS LLC HOT MIX PLT |
48 |
| 1000300128 | DAIMLERCHRYSLER CORPORATION |
49 |
| 1000300365 | DASSAULT FALCON JET-WILMINGTON CORP |
50 |
| 1000300111 | DE SOLID WASTE AUTHORITY CHERRY ISLAND |
51 |
| 1000300086 | DE SOLID WASTE AUTHORITY PIGEON POINT |
52 |
| 1000300090 | DELAWARE CORRECTIONAL CENTER - SMYRNA |
53 |
| 1000300415 | DELAWARE RECYCLABLE PRODUCTS INC |
54 |
| 1000300613 | DELAWARE REFRIGERATED SERVICES |
55 |
| 1000300077 | DEPT OF VETERANS AFFAIRS MEDICAL CENTER |
56 |
| 1000300069 | DIAMOND MATERIALS LLC |
57 |
| 1000300126 | DUPONT CHESTNUT RUN |
58 |
| 1000300010 | DUPONT EDGEMOOR |
59 |
| 1000300011 | DUPONT EXPERIMENTAL STATION |
60 |
| 1000300279 | DUPONT STINE - HASKELL LABORATORY |
61 |
| 1000300049 | DUPONT WILMINGTON OFFICE BUILDING |
62 |
| 1000300073 | E-A-R SPECIALTY COMPOSITES |
63 |
| 1000300040 | EDGEMOOR MATERIALS INC |
64 |
| 1000300051 | FMC BIOPOLYMER |
65 |
| 1000300027 | FORMOSA PLASTICS CORPORATION |
66 |
| 1000300037 | FP INTERNATIONAL INC |
67 |
| 1000300500 | GE ENERGY (USA) LLC |
68 |
| 1000300032 | GENERAL CHEMICAL CORPORATION |
69 |
| 1000300015 | GENERAL MOTORS CORPORATION |
70 |
| 1000300513 | HARDCORE COMPOSITES, DIV. OF HARRIS SPEC |
71 |
| 1000300017 | HERCULES INCORPORATED RESEARCH CENTER |
72 |
| 1000300038 | HONEYWELL INTERNATIONAL INC |
73 |
| 1000300367 | INTERNATIONAL PETROLEUM CORP OF DELAWARE |
74 |
| 1000300102 | JOHNSON CONTROLS BATTERY GROUP INC |
75 |
| 1000300350 | KANEKA DELAWARE CORPORATION |
76 |
| 1000300129 | LAFARGE NORTH AMERICA INC |
77 |
| 1000300028 | LAIDLAW CORPORATION |
78 |
| 1000300104 | MACDERMID INC |
79 |
| 1000300291 | MAGELLAN TERMINALS HOLDINGS, L.P. |
80 |
| 1000300383 | MEDAL A DIV OF AIR LIQUIDE ADV TECH US |
81 |
| 1000300074 | METACHEM PRODUCTS LLC |
82 |
| 1000300324 | NORAMCO INC |
83 |
| 1000300018 | NVF COMPANY INC - YORKLYN FACILITY |
84 |
| 1000300030 | OCCIDENTAL CHEMICAL CORPORATION |
85 |
| 1000300282 | PEPSI COLA BOTTLING COMPANY |
86 |
| 1000300016 | PREMCOR DELAWARE CITY REFINERY |
87 |
| 1000300404 | PREMCOR TERMINAL |
88 |
| 1000300093 | PRINTPACK INC |
89 |
| 1000300382 | PTFE COMPOUNDS INC |
90 |
| 1000300463 | PURE GREEN INDUSTRIES INC |
91 |
| 1000300033 | ROHM & HAAS ELECTRONIC MATERIALS CMP TE |
92 |
| 1000300381 | SPATZ FIBERGLASS PRODUCTS |
93 |
| 1000300426 | SPI POLYOLS INC |
94 |
| 1000300133 | ST. FRANCIS HOSPITAL |
95 |
| 1000300021 | SUNOCO INC MARCUS HOOK REFINERY |
96 | 1000300092 | THE CROWELL CORPORATION | |
97 |
| 1000300696 | THE POND ICE ARENA |
98 |
| 1000300048 | TILCON DELAWARE - TERMINAL AVENUE |
99 |
| 1000300058 | UNIQEMA |
100 |
| 1000300067 | UNISOURCE WORLDWIDE INC |
101 |
| 1000300022 | UNIVERSITY OF DELAWARE NEWARK |
102 |
| 1000300127 | VPI FILM LLC |
103 |
| 1000300121 | WESTVACO CORPORATION |
104 |
| 1000300004 | WILMINGTON PIECE DYE CO |
105 |
| 1000300389 | WILMINGTON WASTEWATER TREATMENT PLANT |
106 | Sussex County, DE | 1000500013 | ALLEN FAMILY FOODS INC |
107 |
| 1000500016 | ALLEN'S HATCHERY INC ALLEN'S MILLING |
108 |
| 1000500036 | BAYHEALTH MEDICAL CTR - MILFORD MEMORIAL |
109 |
| 1000500187 | CANNON COLD STORAGE |
110 |
| 1000500029 | CITY OF LEWES POWER PLANT |
111 |
| 1000500108 | CITY OF SEAFORD-ELECTRIC POWER PLANT |
112 |
| 1000500099 | DE SOLID WASTE AUTHORITY SOUTHERN |
113 |
| 1000500120 | EDWARD J. KAYE CONSTRUCTION |
114 |
| 1000500001 | INDIAN RIVER GENERATING STATION |
115 |
| 1000500002 | INVISTA |
116 |
| 1000500183 | J G TOWNSEND |
117 |
| 1000500006 | JOHNSON POLYMER INC |
118 |
| 1000500066 | JUSTIN TANKS LLC |
119 |
| 1000500027 | LEWES DAIRY INC |
120 |
| 1000500093 | MARITRANS |
121 |
| 1000500028 | MIL-DEL CORPORATION |
122 |
| 1000500004 | MOUNTAIRE FARMS OF DELAWARE INC-MILLSBOR |
123 |
| 1000500073 | MOUNTAIRE FARMS OF DELMARVA - SELBYVILLE |
124 |
| 1000500012 | MOUNTAIRE FARMS OF DELMARVA FRANKFORD |
125 |
| 1000500121 | MULTI-TECH INC |
126 |
| 1000500011 | ORIENT CORPORATION OF AMERICA |
127 |
| 1000500003 | PERDUE FARMS - BRIDGEVILLE |
128 |
| 1000500075 | PERDUE FARMS INC - GEORGETOWN |
129 |
| 1000500146 | PERDUE-AGRIRECYCLE LLC |
130 |
| 1000500025 | PICTSWEET COMPANY |
131 |
| 1000500071 | PINNACLE FOODS CORPORATION - VLASIC PLNT |
132 |
| 1000500009 | SEA WATCH INTERNATIONAL LTD |
133 |
| 1000500188 | SEAFORD ICE INC |
134 |
| 1000500196 | THE MARBLE WORKS |
135 |
| 1000500130 | TILCON DELAWARE - GEORGETOWN |
136 |
| 1000500026 | TILCON DELAWARE GUMBORO |
3.4 Stationary Non-Point Sources.
Stationary non-point sources10represent a large and diverse set of individual emission source categories. A non-point source category is either represented by small facilities too numerous to individually inventory, such as restaurants (commercial cooking), or is a common activity, such as fugitive dust from construction and agricultural production. Emissions from the non-point source categories were estimated at the county level.
There are many stationary non-point source categories which emit fine particulate (PM2.5) and/or PM2.5 precursors. These are grouped into the following category types:
Table 3-5 presents a listing of Delaware’s stationary non-point source categories. Note that there were several source categories evaluated, but not included, in the stationary non-point source inventory. These source categories, and the reason for not including them, are:
Table 3-5. Non-Point Sources in Delaware 2002 Base Year Inventory
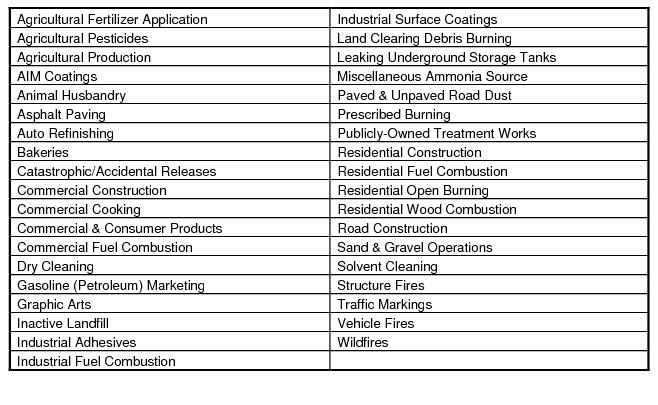
Table 3-6 provides a statewide summary of the 2002 annual (tons per year, TPY) emissions for each non-point source category, and Table 3-7 provides this information for New Castle County.
Table 3-6. Summary of 2002 Statewide Emissions from Non-point Sources 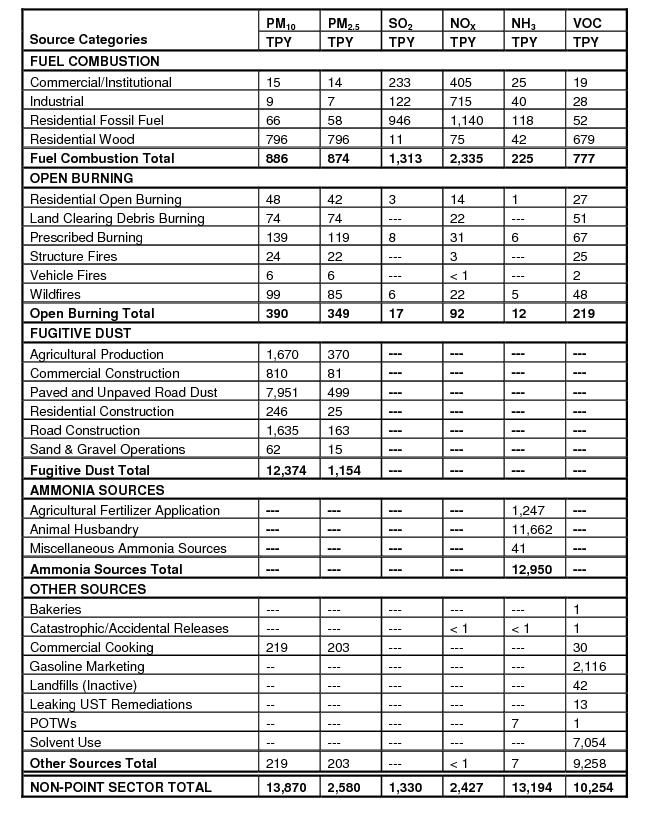
Table 3-7. Summary of 2002 Non-point Emissions for New Castle County
3.5 On-Road Mobile Sources.
The 2002 base year emission inventory of the on-road mobile source sector was conducted by Pechan, with technical support from the EID staff. The on-road mobile sources cover all highway vehicles including passenger cars, light-duty trucks, sport utility vehicles, heavy-duty trucks, buses, and motorcycles, which traveled on Delaware’s roadways in 2002.
The AQM mobile sources lead and EID staff gathered the actual vehicle miles traveled (VMT) on Delaware’s roadways and vehicle mix data from the Delaware Department of Transportation (DelDOT), and evaluated all information about control measures effective in 2002. With the vehicle mix data and control information, Pechan used EPA’s MOBILE6.2 model to generate emission factors for each vehicle type traveling on each of the 11 functional road classes. The emission factors and the VMT data were then used to calculate PM2.5 and precursor emissions for each vehicle type on each road class. The end products of the calculations were sums of PM2.5 and precursor emissions for all vehicles on all road classes in each of the three counties in Delaware. After two rounds of QC/QA reviews and revision by Pechan’s staff and EID staff, the emission data was finalized, and included in the final 2007 base year inventory.
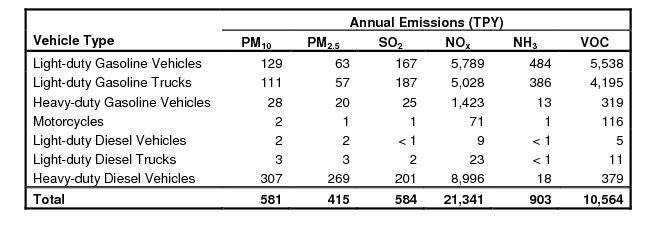
On-road mobile source inventory information is presented in Table 3-8, Table 3-9, and Table 3-10.
Table 3-8. 2002 Annual Emissions and VMT for On-road Mobile Sources by County

Table 3-9. 2002 Annual PM Exhaust, Brake Wear, and Tire Wear Emissions by County

Table 3-10 2002 Statewide Annual Emissions and VMT for On-road Mobile Sources by Vehicle Type
3.6 Non-Road Mobile Sources.
Non-road mobile sources include a large and diverse set of off-road vehicles and non-stationary equipment. Non-road vehicles and equipment were grouped into four source category types for the purpose of developing emission estimates. These groups are:
1. Aircraft – Commercial, military, and private aircraft are considered under this source category.
2. Locomotives – Commercial line haul and yard locomotives are considered under this source category.
3. Commercial Marine Vessels (CMVs) – Various types of vessels that navigate the Delaware Bay and River and the Chesapeake and Delaware Canal are included under this source category. Recreational boats were included in the next category.
4. Other Off-road Vehicles and Equipment – All other off-road emission sources were accounted for through the use of EPA’s NONROAD model. The NONROAD model compiles off-road equipment pertinent to Delaware into the following subcategories:
Emissions from aircraft, locomotives, and CMVs were calculated using appropriate emission factors and emission controls in effect in 2002. Emissions of all other non-road sources (i.e., the 4th group in the list above) were estimated using EPA’s NONROAD model, which further divided these vehicles and equipment by fuel types, including 2-stroke gasoline, 4-stroke gasoline, diesel, liquefied petroleum gas (LPG), and compressed natural gas (CNG). After two rounds of QC/QA reviews and revision by Pechan’s staff and EID staff, the emission data were finalized, and included in the final SIP 2002 base year inventory.
Table 3-11 and Table 3-12 present a summary of Delaware’s 2002 base year inventory for the non-road mobile source sector.
Table 3-11. 2002 Statewide Emissions from Non-road Sources

Table 3-12. 2002 Statewide Annual Emissions for NONROAD Equipment
Fuel Type | Equipment Category | Annual Emissions (TPY) | |||||
PM10 | PM2.5 | SO2 | NOx | NH3 | VOC | ||
Gasoline | Recreational | 19 | 17 | 1 | 23 | < 1 | 612 |
Construction | 7 | 6 | < 1 | 24 | < 1 | 166 | |
Industrial | 1 | 1 | < 1 | 54 | < 1 | 58 | |
Lawn & Garden | 75 | 69 | 6 | 330 | 1 | 2,805 | |
Agriculture | < 1 | < 1 | < 1 | 8 | < 1 | 18 | |
Light Commercial | 5 | 5 | 2 | 96 | < 1 | 413 | |
Logging | < 1 | < 1 | < 1 | < 1 | < 1 | 3 | |
Airport Support | < 1 | < 1 | < 1 | < 1 | < 1 | < 1 | |
Railway Maintenance | < 1 | < 1 | < 1 | < 1 | < 1 | 1 | |
Recreational Marine | 44 | 40 | 4 | 201 | 1 | 2,726 | |
Diesel | Recreational | 1 | 1 | < 1 | 3 | < 1 | 1 |
Construction | 234 | 215 | 299 | 2,415 | 2 | 279 | |
Industrial | 41 | 37 | 56 | 403 | < 1 | 44 | |
Lawn & Garden | 12 | 11 | 13 | 108 | < 1 | 16 | |
Agriculture | 102 | 94 | 92 | 828 | < 1 | 101 | |
Light Commercial | 21 | 19 | 21 | 167 | < 1 | 29 | |
Logging | < 1 | < 1 | 1 | 6 | < 1 | <1 | |
Airport Support | 1 | 1 | 1 | 8 | < 1 | 1 | |
Railway Maintenance | 1 | 1 | 1 | 8 | < 1 | 2 | |
Recreational Marine | 3 | 3 | 14 | 108 | < 1 | 4 | |
LPG | All Equipment | 4 | 4 | 1 | 920 | 0 | 249 |
CNG | All Equipment | < 1 | < 1 | < 1 | 87 | 0 | 1 |
All Fuels | Total | 570 | 525 | 513 | 5,798 | 5 | 7,531 |
3.7 Natural Sources.
Natural sources of emissions of primary particulate matter and particulate matter precursors were included in the 2002 inventory to gain a more complete picture of fine particulate emissions. For Delaware, natural sources include biogenic source emissions (VOCs and NOx), NOx emissions due to lightning, and PM10 and PM2.5-PRI from wind-blown dust. Note that the wildfire category was not included as a natural source, but was instead included in the non-point section because the few wildfires in Delaware are a result of human activities (i.e., untended fire, discarded cigarette butt, arson). Emissions for natural sources are reported for the following activities:
Table 3-13 provides a summary of Delaware’s 2002 emission from natural sources, by county.
Table 3-13. 2002 Emissions for Natural Sources by County
County | Annual Emissions (TPY) | |||||
PM10 | PM2.5 | SO2 | NOx | NH3 | VOC | |
Kent | 7,457 | 1,119 | --- | 251 | --- | 9,139 |
New Castle | 3,007 | 451 | --- | 159 | --- | 6,332 |
Sussex | 10,218 | 1,439 | --- | 354 | --- | 11,109 |
Statewide | 20,682 | 3,009 | --- | 764 | --- | 26,580 |
References
3-1. 2002 Base Year State Implementation Plan Emissions Inventory for PM2.5 and Precursors, Delaware Department of Natural Resources and Environmental Control, Air Quality Management Section, Dover, Delaware, December 15, 2007
As indicted in Section 1 of this Document, Delaware and the entire Philadelphia NAA are required to attain compliance with the PM2.5 NAAQS by April 2010. Since the PM2.5 NAAQS is an annual standard, this effectively requires Delaware and the Philadelphia NAA to attain the PM2.5 NAAQS in 2009 (i.e., 2009 is the last full year prior to the April 2010 attainment date).
This Section presents a projection of the level Delaware expects emissions of PM2.5 and PM2.5 precursors to be in 2009. This projection gives consideration to factors such as growth that will occur between 2002 (i.e., Delaware base year) and control strategies that Delaware and the EPA have adopted which are not included in the 2002 base year, and which will reduce emissions in 2009. This 2009 projection will be evaluated in Sections 5 and 6 of this document to show that emission levels will be sufficiently low in 2009 to yield attainment of the PM2.5 NAAQS.
A complete 2009 projection inventory was coordinated by MANEVU in 2005. This included 2009 emissions projections:
Delaware is basing its 2009 emission projection for this SIP on this work that was coordinated by MANEVU, except as described in this Section.
4.1 Point Source Controls and 2009 Projection Inventory.
4.1.1. Electric Generating Unit (EGU) Emission Projections
The MANE-VU 2002 point source inventory contains a cross-reference table that matches IPM emission unit identifiers (ORISPL plant code and BLRID emission unit code) to MANE-VU NIF emission unit identifiers (FIPSST state code, FIPSCNTY county code, State Plant ID, State Point ID). Initially, MACTEC used this cross-reference table to split the point source file into the EGU and non-EGU components. When there was a match between the IPM ORISPL/BLRID and the MANE-VU emission unit ID, the unit was assigned to the EGU inventory; all other emission units were assigned to the non-EGU inventory.
After performing this initial splitting of the MANE-VU 2002 point source inventory into EGU and non-EGU components, MACTEC prepared several ad-hoc QA-QC queries to verify that there was no double-counting of emissions in the EGU and non-EGU inventories:
As a result of this procedure, MACTEC created separate sets of NIF tables for 2002 EGUs: units accounted for in IPM (i.e., EGUs), and non-EGUs.
The non-EGU set of 2002 NIF tables are used in this SIP to project 2009 Delaware non-EGU point source emissions. This is discussed in detail in Section 4.1.2 of this document. However, after reviewing the IPM results, AQMS found that EGU projections were unrealistic. For example, IPM predicted all of Delaware’s oil-burning EGUs would have no emissions in 2009. Contrary to this, Delaware’s oil-burning EGUs have indicted to the Department that that the oil-burning units will be operating for the foreseeable future. Therefore, Delaware determined that the IPM method was not an accurate method of projected future emissions from EGUs in Delaware, and re-projected EGU emissions using Department of Energy growth factors. Afterwards, Delaware-specific controls from post-2002 regulations were applied. The source of data for determining growth was: Energy Information Administration (EIA), Annual Energy Review 2004 (mid-Atlantic), DOE/EIA-0384 (2004) (Washington, DC, August 2005). Using 2002 as the baseline, 2009 growth factors were derived by taking 2009 projected energy consumption by sector (Energy Consumption) and source (fuel type-quadrillion Btu), and then dividing that by 2003 growth rates.
The following is a list of controls for EGUs, which Delaware has adopted, and which will reduce emissions after 2002 and by 2009. Table 4-1 presents EGU emissions that are calculated by the IPM model:
(1). Reg. 1144, Control of Stationary Generator Emissions, SO2, PM, VOC and NOX emission control, State-wide, Effective January 2006;
(2). Reg. 1146, EGUs, Electric Generating Unit (EGU) Multi-Pollutant Regulation, SO2 and NOX emission control, State-wide, Effective December 2007;
(3). Regulation No. 1148, Control of Stationary Combustion Turbine Electric Generating Unit Emissions, NOX emission control, State-wide, Effective January, 2007.
Table 4-1 EGU emission projections calculated by the Integrated Planning Model (IPM)
County | NH3 | NOx | PM10 | PM2.5 | SO2 | VOC |
Kent | 1 | 474 | 123 | 117 | 1106 | 3 |
New Castle | 15 | 1871 | 475 | 357 | 4056 | 24 |
Sussex | 38 | 8758 | 2078 | 1733 | 25733 | 75 |
Totals | 54 | 11103 | 2677 | 2208 | 30895 | 102 |
Table 4-2 is a summary of Delaware 2009 projection of emissions from EGUs, projected by AQMS staff using the procedure detailed above and applying reductions realized by Regulations 1144, 1146, and 1148.
Table 4-2 2009 EGU emissions – Delaware calculated
County | NH3 | NOx | PM10 | PM2.5 | SO2 | VOC |
Kent | 5 | 803 | 171 | 153 | 2628 | 7 |
New Castle | 39 | 3590 | 781 | 632 | 6146 | 65 |
Sussex | 10 | 4119 | 1556 | 1379 | 9282 | 43 |
Totals | 54 | 8512 | 2508 | 2164 | 18056 | 115 |
4.1.2 Non-EGU Point Source Controls and 2009 Emission Projections
The following is a list of point source controls that Delaware has adopted, and which will reduce emissions after 2002 and by 2009:
(1). Reg. 24. Sec. 46, Crude Oil Lightering Operations, VOC emission control, Sussex County, Effective May 2007;
(2) Regulation 1142, Section 1, Control of NOX Emissions from Industrial Boilers, NOX emission control, Effective December 2001.
(3). Regulation 1142, Section 2, Control of NOX Emissions From Industrial Boilers and Process Heaters at Petroleum Refineries, NOX emission control, New Castle County, Effective July 2007.
(4) Consent Decree with Premcor Refinery at Delaware City (formerly Motiva Enterprises), New Castle County, Control of SO2, and NOX Emission from Boilers and Heaters, Effective 2008.
(5) Facility and Unit shutdowns, as shown in Table 4-3
Table 4-3 Facility and Unit shutdowns
NOx | PM2.5 | SO2 | |||||
County | Facility Name | 2002 | 2009 | 2002 | 2009 | 2002 | 2009 |
Kent | TILCON DELAWARE - HORSEPOND ROAD | 8 | 0 | 4 | 0 | 5 | 0 |
New Castle | AMETEK INC CHEMICAL PRODUCTS DIVISION | 2 | 0 | 0 | 0 | 0 | 0 |
New Castle | CONECTIV DELMARVA GENERATION-MADISON ST | 1 | 0 | 0 | 0 | 0 | |
New Castle | GENERAL CHEMICAL CORPORATION | 91 | 0 | 17 | 0 | 340 | 0 |
New Castle | KANEKA DELAWARE CORPORATION | 5 | 0 | 6 | 0 | 4 | 0 |
New Castle | LAFARGE NORTH AMERICA INC | 69 | 0 | 11 | 0 | 1 | 0 |
New Castle | METACHEM PRODUCTS LLC | 0 | 0 | 0 | 0 | 0 | 0 |
New Castle | VPI FILM LLC | 5 | 0 | 1 | 0 | 0 | 0 |
New Castle | WESTVACO CORPORATION | 0 | 0 | 0 | 0 | 0 | 0 |
New Castle | WILMINGTON PIECE DYE CO | 2 | 0 | 0 | 0 | 0 | 0 |
Sussex | CITY OF LEWES POWER PLANT | 3 | 0 | 0 | 0 | 0 | 0 |
TOTALS = | 186 | 0 | 40 | 0 | 350 | 0 | |
Among the above shutdown facilities, some have applied for and obtained emission reduction credits (ERCs) pursuant to Regulation No. 34, Emission Banking and Trading Program. Table 4-4 is a list of the facilities/agency that hold ERCs.
Table 4-4 Emission Reduction Credits and Holding Facilities/Agency
ERC Holding Facility/Agency | NOx (TPY) |
Kaneka Shutdown | 2 |
Lafarge Shutdown | 37 |
VPI Mirrex Shutdown | 2 |
Delaware Economic Development Office | 72 |
Total | 113 |
In addition, Premcor Refinery (formerly Motiva Enterprises) is under a Consent Agreement that indicates that 250 TPY of NOx reductions will remain available for Premcor Refinery to use as emissions offsets. Thus, the total NOx emission reductions from a facility/unit shutdown, modification and the Premcor Consent Decree that are available for the SIP planning are: (113 + 250) = 363 TPY
These 363 TPY NOx ERCs were added back into the Delaware-adjusted 2009 tables and calculations, since the banked or authorized ERCs are treated as emitted emissions in the context of this SIP revision. As such, the future use of these credits is consistent with, and will not interfere with any calculation or provision of this SIP document.
For the non-EGU point source sector Delaware has substantially relied upon the 2009 projection of emissions done by MACTEC. This projection is summarized earlier in this document, and a detailed description is provided in Appendix 4-1 to this document. However, there are several instances where MACTEC’s projections have been revised by AQMS staff. The reasons for each such revision are provided in Appendix 4-2 of this document. The final 2009 projections are detailed in Appendix 4-3.
Table 4-5 provides a summary of the 2009 MACTEC non-EGU point source projection.
Table 4-5 Summary of the MACTEC 2009 Non-EGU Point Source Projection
County | NH3 | NOx | PM10 | PM2.5 | SO2 | VOC |
Kent | 18 | 184 | 52 | 32 | 170 | 105 |
New Castle | 71 | 3566 | 1270 | 1138 | 5787 | 1718 |
Sussex | 56 | 326 | 163 | 86 | 1160 | 1164 |
Totals | 145 | 4076 | 1485 | 1256 | 7117 | 2987 |
Table 4-6 provides a summary of the non-EGU point source emissions where MACTEC’s projections are not revised by the Department.
Table 4-6 Summary of the Un-Revised Portion of the MACTEC 2009 Non-EGU Point Source Projection
County | NH3 | NOx | PM10 | PM2.5 | SO2 | VOC |
Kent | 18 | 170 | 44 | 25 | 154 | 96 |
New Castle | 71 | 3355 | 493 | 361 | 5782 | 1404 |
Sussex | 26 | 324 | 162 | 85 | 1160 | 60 |
Totals | 115 | 3849 | 699 | 471 | 7096 | 1560 |
Table 4-7 is a summary of Delaware 2009 projection of emissions from non-EGU point sources, where MACTEC’s projections are revised by AQMS staff. Reasons for each such revision are provided in Appendix 4-2.
Table 4-7 Summary of the Revised Portion of the MACTEC 2009 Non-EGU Point Source Projection
County | NH3 | NOx | PM10 | PM2.5 | SO2 | VOC |
Kent | 0 | 8 | 2 | 1 | 0 | 6 |
New Castle | 0 | 113 | 573 | 476 | 28 | 1311 |
Sussex | 1 | 1 | 1 | 0 | 0 | 1034 |
Totals | 1 | 122 | 576 | 477 | 28 | 2351 |
Table 4-8 provides a summary of Delaware’s projected 2009 emissions from non-EGUs (i.e., the sum of Table 4-6 and Table 4-7).
Table 4-8 Summary of the Delaware Non-EGU Point Source Projection
County | NH3 | NOx | PM10 | PM2.5 | SO2 | VOC |
Kent | 18 | 177 | 46 | 26 | 154 | 102 |
New Castle | 71 | 3467 | 1066 | 837 | 5811 | 2715 |
Sussex | 28 | 325 | 163 | 85 | 1160 | 1094 |
Totals | 117 | 3969 | 1275 | 949 | 7125 | 3911 |
4.1.3 EGU and Non-EGU Point Source 2009 Emission Projections Summary
Delaware’s total projected 2009 point source emissions are the sum of the EGU point source projections (i.e., Table 4-2), the non-EGU point source projections(i.e., Table 4-8) and the ERCs (363 TPY NOx). This summation is presented in Table 4-9.
Table 4-9 Summary of Delaware 2009 EGUs and non-EGUs Point Source Projection
County | NH3 | NOx | PM10 | PM2.5 | SO2 | VOC |
Kent | 22 | 981 | 217 | 178 | 2782 | 110 |
New Castle | 110 | *7420 | 1847 | 1469 | 11957 | 2780 |
Sussex | 38 | 4444 | 1719 | 1465 | 10442 | 1138 |
Totals | 170 | 12845 | 3783 | 3112 | 25181 | 4028 |
* Includes ERC adjusted emissions
4.2 Non-Point Source Controls and 2009 Emission Projections
The following is a list of non-point source controls that Delaware has adopted, and which will reduce emissions after 2002 and by 2009:
(1). Reg. 24 Sec. 33, Solvent Cleaning and Drying, VOC emission control, Statewide, Effective November, 2002.
(2). Reg. 24 Sec. 11, Mobile Equipment Repair and Refinishing, VOC emission control, State-wide, Effective October, 2003.
(3). Reg. 41 Sec. 3, Portable Fuel Containers, VOC emission control, State-wide, Effective January 2003.
(4). Reg. 41 Sec. 2, Consumer Products, VOC emission control, State-wide, Effective January 2005.
(5). Reg. 41 Sec 1, Architectural and Industrial Maintenance Coatings, VOC emission control, State-wide, Effective January 2005.
(6). Federal Residential Woodstove NSPS, VOC, PM and NOx emission control.
(7). Reg. 1113, Open Burning, PM, VOC and NOx emission control, State-wide, Revised and Effective April 2007.
For the non-point source sector Delaware has substantially relied upon the 2009 projection of emissions done by MACTEC. This projection is summarized earlier in this document, and a detailed description is provided in Appendix 4-1 to this document. However, there are several instances where MACTEC’s projections have been revised by AQMS staff. The reasons for each such revisions are provided in Appendix 4-2 of this document. Final 2009 projections are detailed in Appendix 4-3.
Table 4-10 is a summary of MACTEC’s 2009 Emissions from All Non-Point Sources.
Table 4-10 Summary of the MACTEC 2009 Non-Point Source Projection
County | NH3 | NOx | PM10 | PM2.5 | SO2 | VOC |
Kent | 2033 | 439 | 3429 | 774 | 289 | 2660 |
New Castle | 1312 | 1313 | 4847 | 1208 | 796 | 7338 |
Sussex | 9971 | 1069 | 5652 | 1405 | 513 | 4245 |
Totals | 13316 | 2821 | 13928 | 3387 | 1598 | 14243 |
Table 4-11 provides a summary of the non-point source emissions where MACTEC’s projections are not revised by the Department.
Table 4-11 Summary of the Un-Revised Portion of the MACTEC 2009 Non-Point Source Projection
County | NH3 | NOx | PM10 | PM2.5 | SO2 | VOC |
Kent | 28 | 62 | 152 | 112 | 20 | 779 |
New Castle | 78 | 78 | 472 | 411 | 67 | 2996 |
Sussex | 33 | 45 | 109 | 96 | 21 | 915 |
Totals | 139 | 185 | 733 | 619 | 108 | 4690 |
Table 4-12 is a summary of Delaware 2009 projection of emissions from non-point sources, where MACTEC’s projections are revised by AQMS staff. Reasons for each such revision is are provided in Appendix 4-2.
Table 4-12 Summary of the Revised Portion of the MACTEC 2009 Non-Point Source Projection
County | NH3 | NOx | PM10 | PM2.5 | SO2 | VOC |
Kent | 2657 | 326 | 2595 | 461 | 211 | 722 |
New Castle | 666 | 1616 | 3111 | 654 | 716 | 2096 |
Sussex | 9777 | 518 | 3520 | 693 | 296 | 1013 |
Totals | 13100 | 2460 | 9226 | 1808 | 1223 | 3831 |
Table 4-13 provides a summary of Delaware’s projected 2009 emissions from non-point sources (i.e., the sum of Table 4-11 and Table 4-12).
Table 4-13 Summary of the Delaware Non-Point Source Projection
County | NH3 | NOx | PM10 | PM2.5 | SO2 | VOC |
Kent | 2685 | 388 | 2747 | 573 | 231 | 1501 |
New Castle | 743 | 1694 | 3583 | 1065 | 782 | 5092 |
Sussex | 9810 | 564 | 3629 | 789 | 316 | 1928 |
Totals | 13238 | 2646 | 9959 | 2427 | 1329 | 8521 |
4.3 Non-Road Mobile Source Controls and 2009 Emission Projections
The controls for non-road mobile engines (except aircraft, locomotives, and marine vessels) that were applied when projecting their 2009 emissions include all relevant federal rules, such as fuel sulfur content rule, gasoline Reid Vapor Pressure (RVP) requirements, and reformulated fuel programs. MACTEC used EPA’s NMIM2005 model and NONROAD2005 model to estimate annual emission projections of non-road engines in all MANE_VU states, including Delaware (see MACTEC’s TSD, Appendix 4-1).
In addition to the non-road engines, MACTEC also conducted 2009 annual emission projections for aircraft, locomotives and marine vessels for all MANE-VU states. Controls for the 2009 emissions include all relevant federal rules and requirements, as outlined below.
(1) Phase I and Phase II Emissions Standards for Gasoline-Powered Non-Road Utility Engines, Federal Rule
This standard promulgated by the EPA applies to VOC emissions from small non-road, spark-ignition (i.e., gasoline-powered) utility engines, as authorized under 42 U.S.C. §7547. The measure affects gasoline-powered (or other spark-ignition) lawn and garden equipment, construction equipment, chain saws, and other such utility equipment as chippers and stump grinders, wood splitters, etc., rated at or below 19 kilowatts (an equivalent of 25 or fewer horsepower). Phase 2 of the rule applied further controls on handheld and non-handheld outdoor equipment. See References 4-2, 4-3, and 4-4.
(2) Emissions Standards for Diesel-Powered Non-Road Utility Engines of 50 or More Horsepower, Federal Rule
This standard promulgated by the EPA applies to VOC and NOX emissions from non-road, compression-ignition (i.e., diesel-powered) utility engines, as authorized under 42 U.S.C. § 7547. The measure affects diesel-powered (or other compression-ignition) construction equipment, industrial equipment, etc., rated at or above 37 kilowatts (37 kilowatts is approximately equal to 50 horsepower). See References 4-5, 4-6, and 4-7.
(3) Emissions Standards for Spark Ignition (SI) Marine Engines, Federal Rule
This standard promulgated by the EPA applies to exhaust PM, VOC and NOx emissions from new spark-ignition (SI) gasoline marine engines, including outboard engines, personal watercraft engines, and jet boat engines. Of nonroad sources studied by EPA, gasoline marine engines were found to be one of the largest contributors of hydrocarbon (HC) emissions (30 percent of the nationwide nonroad total).
(4) Emissions Standards for Large Spark Ignition Engines, Federal Rule
This EPA measure controls VOC and NOx emissions from several groups of previously unregulated nonroad engines, including large industrial spark-ignition engines.
Since emissions from aircraft, commercial marine vessels, and locomotives are not projected by the NONROAD model, emission projections for these sources were developed separately. The starting point for the emission projections was Version 3 of the MANE_VU 2002 Nonroad emission inventory (Documentation of the MANE-VU 2002 Nonroad Sector Emission Inventory, Version 3, Draft Technical Memorandum, March 2006). MACTEC’s approach to developing emission projections for these sources was to use combined growth and control factors developed from emission projections for U.S. EPA’s Clean Air Interstate Rule (CAIR) development effort. MACTEC obtained emission projections developed for the CAIR rule. MACTEC then calculated the combined growth and control factors by determining the ratio of emissions between 2002 and each of the MANE-VU projection years (2009, 2012, and 2018). The CAIR emissions were available for 2001, 2010, 2015 and 2020. Thus, they developed intermediate year estimates using linear interpolation between the actual CAIR years and the MANE-VU years.
Using this approach MACTEC developed State/county/SCC/pollutant growth/control factors for use in projecting the MANE-VU base year data to 2009. These values were then used to multiply times the base year value to obtain the projected values. Since the development of the CAIR factors included both growth and controls, no separate control factors were developed for these sources except where exceptions to this method were used for States that requested alternative growth/control methods (see below).
Once the CAIR factors were developed, MACTEC compared the SCCs contained in the CAIR inventory with those used in MANE-VU. In some cases there were differences. In cases where a similar SCC in the CAIR inventory could be assigned to the SCC in the MANE-VU inventory the State/County/SCC/pollutant growth and control factor for the substitute was assigned to the MANE-VU SCC. If no corresponding county SCC substitution could be found, a State or MANE-VU regional average value for the substitute SCC was developed and assigned for use in projecting emissions. The substitution scheme was to use State values first, then MANE-VU regional values if the State value couldn’t be used.
For the non-road mobile source sector Delaware has substantially relied upon the 2009 projection of emissions done by MACTEC, as described above. However, there are several instances where MACTEC’s projections have been revised by AQMS staff. The reasons for each such revision are provided in Appendix 4-2 of this document.
Table 4-14 is a summary of MANEVU 2009 Emissions from All Non-road Sources.
Table 4-14 Summary of the MACTEC 2009 Non-Road Mobile Source Projection
County | NH3 | NOx | PM10 | PM2.5 | SO2 | VOC |
Kent | 1 | 4251 | 223 | 201 | 618 | 1394 |
New Castle | 2 | 7436 | 423 | 382 | 1297 | 2543 |
Sussex | 2 | 3752 | 301 | 274 | 935 | 2503 |
Totals | 5 | 15439 | 947 | 857 | 2850 | 6440 |
Table 4-15 provides a summary of the non-road mobile source emissions where MACTEC projections are not revised by the Department.
Table 4-15 Summary of the Un-Revised Portion of the MACTEC 2009 Non-Road Mobile Source Projection
County | NH3 | NOx | PM10 | PM2.5 | SO2 | VOC |
Kent | 1 | 3272 | 201 | 181 | 556 | 1383 |
New Castle | 2 | 3131 | 249 | 225 | 294 | 2486 |
Sussex | 2 | 3123 | 290 | 264 | 901 | 2498 |
Totals | 5 | 9526 | 740 | 670 | 1751 | 6367 |
Table 4-16 is a summary of Delaware 2009 projection of emissions from non-road mobile sources, where MACTEC’s projections are revised by AQMS staff. Reasons for each such revision is are provided in Appendix 4-2.
Table 4-16 Summary of the Revised Portion of the MACTEC 2009 Non-Road Source Projection
County | NH3 | NOx | PM10 | PM2.5 | SO2 | VOC |
Kent | 0 | 1235 | 28 | 25 | 79 | 13 |
New Castle | 1 | 4658 | 186 | 169 | 1052 | 63 |
Sussex | 0 | 753 | 13 | 11 | 42 | 6 |
Totals | 1 | 6646 | 227 | 205 | 1173 | 82 |
Table 4-17 provides a summary of Delaware’s projected 2009 emissions from non-road mobile sources (i.e., the sum of Table 4-15 and Table 4-16).
Table 4-17 Summary of the Delaware Non-Road Mobile Source Projection
County | NH3 | NOx | PM10 | PM2.5 | SO2 | VOC |
Kent | 2 | 4508 | 229 | 206 | 635 | 1396 |
New Castle | 3 | 7789 | 435 | 394 | 1345 | 2549 |
Sussex | 2 | 3876 | 304 | 276 | 943 | 2504 |
Totals | 7 | 16173 | 968 | 876 | 2923 | 6449 |
4.4 On-Road Mobile Source Controls and 2009 Emission Projections
The on-road mobile source emission projections have been conducted by AQM staff members using EPA’s MOBILE6.2 model. Delaware Department of Transportation (DelDOT) provided vehicle miles traveled (VMT) on Delaware’s roadways and vehicle mix data for 2009. The on-road mobile source controls in the input files for the 2009 MOBILE6.2 runs include the following:
(1) Low enhanced I/M program of model years 1968 and newer, Kent and New Castle.
(2) On-Board Diagnostic checks of model years 1996 and newer, statewide.
(3) Anti-tampering program of model years of 1975 and newer, statewide.
(4) NLEV program, statewide.
(5) Low emission vehicle program/Tier 2 emission standards/low sulfur rule, statewide.
(6) Heavy Duty Diesel Rule/low Sulfur rule, statewide.
Table 4-18 is a summary of on-road mobile emissions calculated by NESCAUM and New York using the SMOKE model.
Table 4-18 (NESCAUM/NY) 2009 Mobile Projections
County | NH3 | NOx | PM10 | PM2.5 | SO2 | VOC |
Kent | 179 | 3206 | 93 | 61 | 17 | 1426 |
New Castle | 711 | 8862 | 278 | 163 | 63 | 4854 |
Sussex | 281 | 4096 | 131 | 83 | 27 | 2512 |
Totals | 1171 | 16164 | 502 | 307 | 107 | 8792 |
The above emissions were calculated with data the Department submitted to MANVU in October, 2006. Projected VMT and vehicle speed data for 2009 were prepared by the Delaware Department of Transportation in July, 2005 for the NESCAUM and New York using the SMOKE model.
The Department recalculated 2009 on-road mobile source emission projections, using updated VMT and speeds provided by DELDOT that the Department received in the spring of 2007. The input files of the 2009 MOBILE6.2 runs, the emission factors generated and relevant calculations for emission projections are presented in Appendices 4-4. Sample calculations are provided in Appendix 8-1. The updated VMT and speeds data accounts for the differences in the two tables.
Table 4-19 Delaware 2009 Mobile projections using the most up-to-date VMT and speeds
County | NH3 | NOx | PM10 | PM2.5 | SO2 | VOC |
Kent | 178 | 1922 | 60 | 32 | 16 | 1223 |
New Castle | 610 | 4904 | 174 | 87 | 51 | 3466 |
Sussex | 256 | 2707 | 79 | 41 | 23 | 1988 |
Totals | 1044 | 9533 | 313 | 160 | 90 | 6677 |
4.5 Summary of Delaware’s Overall Projected 2009 Inventory
Tables 4-20 and 4-21 are the sum of 2009 projections that were coordinated by MANEVU and the result of the revisions made by Delaware, as explained above, respectively.
Table 4-20 2009 projections – all sectors – MANEVU
County | NH3 | NOx | PM10 | PM2.5 | SO2 | VOC |
Kent | 2233 | 8554 | 3448 | 1185 | 2201 | 5587 |
New Castle | 2112 | 23048 | 6379 | 3249 | 12001 | 16478 |
Sussex | 10347 | 18001 | 5756 | 3581 | 28368 | 10499 |
Totals | 14691 | 49602 | 15583 | 8014 | 42569 | 32564 |
Table 4-21 2009 projections – all sectors – Delaware
County | NH3 | NOx | PM10 | PM2.5 | SO2 | VOC |
Kent | 2887 | 7799 | 3253 | 989 | 3664 | 4230 |
New Castle | 1466 | 21807 | 6039 | 3015 | 14135 | 13887 |
Sussex | 10106 | 11591 | 5731 | 2571 | 11724 | 7558 |
Totals | 14459 | 41197 | 15023 | 6575 | 29523 | 25675 |
5.0 2009 Emissions Attainment Targets
Delaware is required by the CAA and the March 30, 2007 PM2.5 Implementation Rule to demonstrate how it, and the associated non-attainment area, will attain compliance with annual PM2.5 NAAQS by 2010. This demonstration is substantially discussed in Section 6 of this document. Section 6 of this document presents a detailed Weight of Evidence (WOE) analysis, which includes CMAQ modeling. This CMAQ modeling is a core component of the WOE analysis, and a significant input to the model is 2009 emission levels.
The 2009 modeling inventory is the 2009 projection inventory that was coordinated by MANEVU in 2005. This 2009 projection inventory was discussed in Section 4 of this document, and is presented in detail in Appendix 4-3 to this document. Table 4-20, 2009 projections – all sectors – MANEVU, shows the New Castle County emission levels that were modeled with CMAQ for 2010. For convenience, the information from Table 4-20 has been copied to this section and named table 5-1.
Table 5-1 CMAQ Modeled 2009 Emissions, i.e. Attainment Targets
County | NH3 | NOx | PM10 | PM2.5 | SO2 | VOC |
New Castle | 2112 | 23048 | 7294 | 3249 | 12001 | 16478 |
The Departments WOE analysis, which includes CMAQ using the emission levels in Table 5-1, demonstrates that both Delaware and the entire Philadelphia Non-attainment area will be in attainment with the annual PM2.5 NAAQS in 2010. Therefore, the emission levels in Table 5-1 are the targeted level of emissions needed for attainment.
As discussed in Section 4 of this document, Delaware has updated MACTEC’s 2009 projection inventory based on the latest information available. Table 4-21, 2009 projections – all sectors – Delaware, shows the emission levels that are projected for 2009. For convenience, the information from Table 4-21 has been copied to this section and named table 5-2.
Table 5-2 New Castle Projected 2009 Emissions (Control Strategy Emissions)
County | NH3 | NOx | PM10 | PM2.5 | SO2 | VOC |
New Castle | 1466 | 21807 | 6039 | 3015 | 14135 | 13887 |
Table 5-3 below presents the Attainment Targets (i.e., Table 5-1) minus the DE Control Strategy Emissions (i.e., Table 5-2). Positive values indicated that DE projects emissions in 2009 to be lower than the levels that are needed for attainment. Conversely, negative values indicate that DE projects emissions in 2009 to be higher than levels that are needed for attainment.
Table 5-3 Attainment Demonstration (CMAQ Modeled 2009 Emissions minus DE Projected 2009 Emissions)
County | NH3 | NOx | PM10 | PM2.5 | SO2 | VOC |
New Castle | 646 | 1,241 | 1255 | 234 | -2134 | 2591 |
Table 5-3 indicates that emission levels in New Castle County for all pollutants except for SO2 are projected to be below the levels that are necessary for attainment. Relative to SO2 there is a projected 2,134 TPY shortfall.
Because of the regional nature of secondarily-formed sulfate and nitrate, and the broad modeling domain of the CMAQ modeling, which included all of Delaware, emission reductions from Kent and Sussex counties will contribute to attainment within New Castle County and the Philadelphia NAA. Kent and Sussex counties are within the State of Delaware, contiguous to New Castle County, and are less than 200 kilometers away. The PM2.5 Implementation Rule allows states to consider in-state NOX and SO2 credits in their SIPs from sources up to 200 kilometers away from the non-attainment area.13
Table 5-4 shows that there is a statewide SO2 “surplus” of 13,047 TPY relative to the emission levels that are consistent with attainment. This indicates that while New Castle County (i.e., Delaware’s only area designated non-attainment with respect to the annual PM2.5 NAAQS) is not projected to have reductions in SO2 consistent with attainment (i.e., 2,134 shortfall based on CMAQ modeling), overall DE SO2 emissions levels are consistent with attainment.
Table 5-4 SO2 “surplus/shortfall”
CMAQ 2009 Modeled SO2 Inventory (TPY) | DE 2009 Projected SO2 Emissions (TPY) | Surplus/ Shortfall (TPY) | |
Kent | 2201 | 3664 | -1463 |
New Castle | 12001 | 14135 | -2134 |
Sussex | 28368 | 11724 | 16644 |
Total | 42569 | 29523 | 13047 |
In summary, Delaware projects that its 2009 emission levels of all pollutants considered in its attainment demonstration and WOE analysis, which is discussed in detail in Section 6 of this document, will be below the levels necessary for attainment.
6.1 Background and Objectives
The Clean Air Act requires the U.S. Environmental Protection Agency (EPA) to establish National Ambient Air Quality Standards (NAAQS) that adequately protect the public health. In 1997, EPA established new standards for fine particulate matter (PM2.5), which include an annual standard of 15 micrograms per cubic meter (ìg/m3) based on the 3-year average of annual mean PM2.5 concentrations, and a 24-hour standard of 65 ìg/m3 based on the 3-year average of the 98th percentile of 24-hour concentrations.
On December 17, 2004, the EPA designated areas for the PM2.5 NAAQS. The Philadelphia-Wilmington (PA-NJ-DE) nonattainment area (NAA) has been classified as a nonattainment area for PM2.5 with an attainment date of April 5, 2010. The PA-NJ-DE nonattainment area for PM2.5 includes one county in Delaware, five counties in Pennsylvania, and three counties in New Jersey being in nonattainment for the PM2.5 NAAQS. Table 6-1 identifies all jurisdictions that EPA has designated as nonattainment for PM2.5 within the PA-NJ-DE NAA.
Table 6-1: PA-NJ-DE Designations for the PM2.5 NAAQS
Jurisdiction | Counties | Classification | Maximum Attainment Date |
Delaware | New Castle | Nonattainment | April 5, 2010 |
Pennsylvania | Bucks Chester Delaware Montgomery Philadelphia | ||
New Jersey | Burlington Camden Gloucester |
Once an area is designated as nonattainment, the Clean Air Act requires the submittal of an implementation plan to EPA within three years. State Implementation Plans (SIPs) are due in April 2008. States may also propose an attainment date extension for up to five years. Those areas for which EPA approves an extension must achieve clean air as soon as possible, but no later than April 5, 2015.
Figure 6-1 provides a graphical representation of the Philadelphia-Wilmington (PA-NJ-DE) nonattainment area.
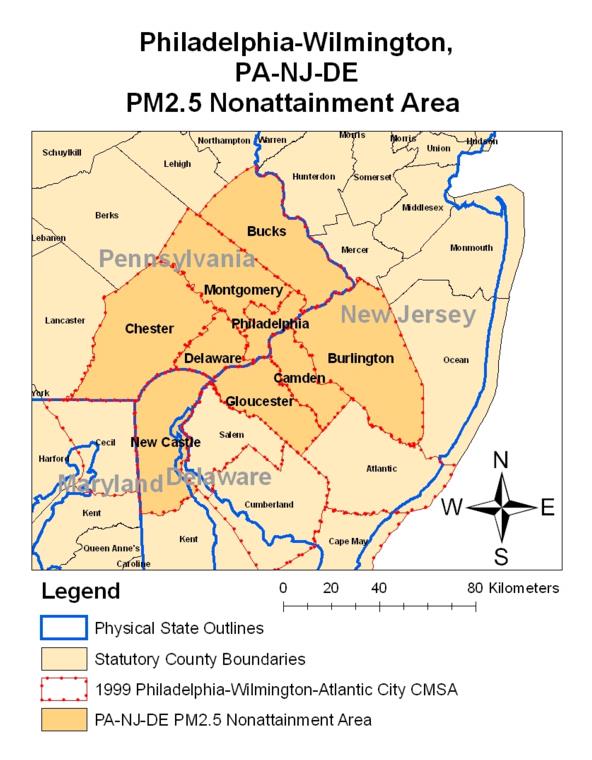
Figure 6-1: The Philadelphia-Wilmington (PA-NJ-DE) nonattainment area
The Agencies responsible for making the attainment demonstration for the Philadelphia-Wilmington (PA-NJ-DE) nonattainment area are the Delaware Department of Natural Resources and Environmental Control (DNREC), the Pennsylvania Department of the Environment (PADEP), and the New Jersey Department of the Environment (NJDEP). These agencies are responsible for preparing and submitting their SIPS to the EPA.
This modeling study demonstrates that the PA-NJ-DE nonattainment area attains the PM2.5 standards by April 5, 2010. The procedures followed in this modeling study are in accordance with the EPA’s Guidance on the Use of Models and Other Analyses for Demonstrating Attainment of Air Quality Goals for Ozone, PM2.5, and Regional Haze (EPA-454/B-07-002, April 2007).
The State Agencies (DNREC, PADEP, NJDEP) are also members of the Ozone Transport Commission (OTC) modeling committee. The OTC modeling centers, which include New York State Department of Environmental Conservation (NYSDEC), the University of Maryland (UMD), the Northeast States for Coordinated Air Use Management (NESCAUM) and the Virginia Department of Environmental Quality (VADEQ), performed the modeling. Modeling inventories were developed, updated and shared among the regional modeling centers and provided by the Mid-Atlantic Regional Air Management Association (MARAMA) and Mid-Atlantic North East Visibility Union (MANE-VU) Regional Planning Organization (RPO). The Policy and Technical Advisory Committees oversaw the modeling work. These Committees provided reports through regular briefings and offered information in cases where specific technical decisions had policy implications.
6.2 Conceptual Model
EPA recommends that a conceptual description of the area’s PM2.5 problem be developed prior to the initiation of any air quality modeling study. A “conceptual description” is a qualitative way of characterizing the nature of an area’s nonattainment problem. Within the conceptual description of a particular modeling exercise, it is recommended that the specific meteorological parameters that influence air quality be identified and qualitatively ranked in importance.
The conceptual model for this study consists of two documents - The Nature of the Fine Particle and Regional Haze Air Quality Problems in the MANE-VU Region: A Conceptual Description (NESCAUM, November 2006) and The Development of PM2.5 Forecasting Tools for Selected Cities in the MARAMA Region (ICF, September 2004). The first document was prepared by NESCAUM for use by the OTC member States, and it provides the conceptual description of the fine particle issues in the OTC states, consistent with the EPA’s guidance. The second document is prepared by ICF for MARAMA and is the basis of the MARAMA PM2.5 forecasting tool for nine cities in the MARAMA region. The nine cities for which the PM2.5 forecasting tool was developed are - Charlotte, North Carolina; Bristol, Roanoke, and Richmond, Virginia; Washington, D.C.; Baltimore, Maryland; Philadelphia, Pennsylvania; Wilmington, Delaware; and Newark/Elizabeth, New Jersey. The study included the analysis of PM2.5 and meteorological data using Classification and Regression Tree (CART) analysis software and the development, testing, and evaluation of interactive forecasting tools for each area. Data and information gathered throughout the course of the project were used, together with the CART analysis results, to describe the relationships between meteorology, and PM2.5 concentration and specifically, the conditions associated with high PM2.5 events in each forecast area. Both of these documents are provided in Appendices 6-1 and 6-2.
6.3 Modeling Domain and Photochemical Modeling System
6.3.1 Episode Selection
Due to the fact that the attainment demonstration is being conducted using a resource intensive photochemical grid model, EPA accepts the use of a single, recent “representative” year to be used for an annual model simulation. Two factors were used in selecting 2002 as the “representative” year - the observed annual mean concentrations of PM2.5 are close to the 3-year observed design value at all, or most monitoring sites, and the pattern of quarterly mean values is similar to the pattern of quarterly mean concentrations averaged over 3 years.
6.3.2 Photochemical Modeling Domain
The Ozone Transport Commission (OTC) modeling committee selected the EPA’s Community Multi-Scale Air Quality (CMAQ) model for this modeling effort. The CMAQ model is also recommended by the Guidance on the Use of Models and Other Analyses for Demonstrating Attainment of Air Quality Goals for Ozone, PM2.5, and Regional Haze (EPA-454/B-07-002, April 2007). Two CMAQ modeling domains were defined - the outer domain at a 36-km horizontal grid resolution covering the continental U.S. and the inner domain at 12-km horizontal grid resolution covering the OTR (see Figure 6-2). The outer domain with 36-km horizontal grid resolution is the same national grid adopted by the Regional Planning Organizations (RPOs) for the original purpose of modeling regional haze SIP demonstrations but also serves the purpose of ozone evaluation. However, the inner domain, with 12-km horizontal grid resolution in the northeastern U.S., is the focus of and the justification for all activities pursuant to demonstrating attainment of the PM2.5 NAAQS. The CMAQ domain is nested in the Mesoscale Meteorological Model (MM5) domain. A larger MM5 domain was selected for both MM5 simulations to provide a buffer of several grid cells around each boundary of the CMAQ 36-km domain. This was designed to eliminate any errors in the meteorology from boundary effects in the MM5 simulation at the interface of the MM5 model. The CMAQ vertical structure is primarily defined by the vertical grid used in the MM5 modeling.
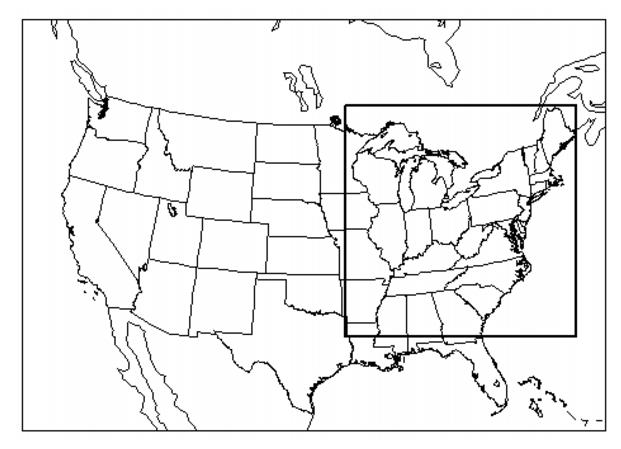
Figure 6-2: PM2.5 Modeling Domains at 36- and 12-km for the OTR
6.3.3 Initial and Boundary Conditions
The objective of a photochemical grid model is to estimate the air quality given a set of meteorological and emissions conditions. When initializing a modeling simulation, the exact concentration fields are unknown in every grid cell for the start time. Therefore, typically photochemical grid models are started with clean conditions within the domain and allowed to stabilize before the period of interest is simulated. In practice this is accomplished by starting the model several days prior to the period of interest.
The winds move pollutants into, out of, and within the domain. The model handles the movement of pollutants within the domain and out of the domain. An estimate of the quantity of pollutants moving into the domain is needed. These are called boundary conditions. To estimate the boundary conditions for the modeling study, three-hourly boundary conditions for the outer 36-km domain were derived from an annual model run performed by researchers at Harvard University using the GEOS-CHEM global chemistry transport model. The influence of boundary conditions was minimized by using a 15-day ramp-up period which is sufficient to establish pollutant levels that are encountered in the beginning of an air pollution episode.
6.3.4 Meteorological Model Selection
The Pennsylvania State University/National Center for Atmospheric Research (PSU/NCAR) Mesoscale Meteorological Model (MM5) was selected for application in the modeling analysis. MM5 is a non-hydrostatic, prognostic meteorological model routinely used for urban- and regional-scale photochemical regulatory modeling studies.
6.3.5 Emissions Inventories
Emissions processing necessary for the 2002 base case and 2009 future case modeling required coordination amongst the Regional Planning Organizations (RPOs). Each RPO was responsible for processing of both its anthropogenic and biogenic emissions. The emissions data for 2002 was generated by individual states within the OTR and then assembled and processed through the MANE-VU. These emissions were then processed by the NYSDEC using Sparse Matrix Operator Kernel Emissions (SMOKE) modeling system, an emissions processor for CMAQ, to provide model-ready inputs. The 2002 emissions for the non-OTR areas within the modeling domain were obtained from the corresponding RPOs and were processed using SMOKE.
Emissions inventories for 2009 needed for the MANE-VU RPO are developed by a number of entities. A contractor (MACTEC) in consultation with the states developed the necessary growth and control factors and applied them to the 2002 inventory. Mobile source emissions are developed by VADEQ and NESCAUM. The inter-RPO workgroup developed the state and unit-level emissions by utilizing the Integrated Planning Model (IPM). The 2009 emissions inventories utilized in modeled attainment demonstrations are identified as 2009 on-the-books/on-the-way (2009OTB/OTW) inventories as they represent all control measures that were promulgated or would become effective on or before 2009.
6.4 Model Performance Evaluation
6.4.1 Overview
A critical component of every air quality modeling study is the model performance evaluation where the modeled estimates for the current year base case are compared against observed values to assess the model’s accuracy and provide an indication of its reliability. This section lays out the procedures and results of the evaluation. It should be noted that the other parts of the modeling process, the emissions and meteorology, also undergo an evaluation. It is with this knowledge and the desire to keep the report concise, that the air quality model became the primary focus of this section.
The first step in the modeling process is to verify the model’s performance in terms of its ability to predict the PM2.5 and its individual components (i.e., sulfate, nitrate, ammonium, organic carbon, elemental carbon and other PM2.5) in the right locations and at the right levels. To do this, the model predictions for the base year simulation are compared to the ambient data observed in the historical episode. This verification is a combination of statistical and graphical evaluations. If the model appears to be producing PM2.5 in the right locations for the right reasons, then the model can be used as a predictive tool to evaluate various control strategies and their effects on PM2.5.
The results of a model performance evaluation were reviewed prior to using modeling to support the attainment demonstration. The New York State DEC, Division of Air Resources, conducted a performance evaluation of the 2002 base case CMAQ simulation on behalf of the OTC member States. Appendix 6-3 provides comprehensive operational and diagnostic evaluation results, including spreadsheets containing the assumptions made to compute statistics. Highlights of this evaluation are provided in the following sections.
6.4.2 Diagnostic and Operational Evaluation
The issue of model performance goals for PM2.5 is an area of ongoing research and debate. To evaluate model performance, EPA recommends that several statistical metrics be developed for air quality modeling. Performance goals refer to targets that a good performing model should achieve, whereas performance benchmarks are based on historical model performance measures for the best performing simulations. Performance goals are necessary in order to provide consistency in model applications and expectations across the country and to provide standardization in how much weight may be accorded modeling study results in the decision-making process.
When EPA’s guidance was first developed nearly four (4) years ago, an interim set of fine particulate modeling performance goals were suggested for aggregated mean normalized gross error and mean normalized bias as defined in Table 6-2:

Because regional-scale PM2.5 modeling is an evolving science, and considerable practical application and performance testing has transpired in the intervening years since these goals were postulated, they are considered as general guidelines. It may also be possible to adopt levels of model performance goals for bias and gross error as listed in Table 6-3 to help evaluate model performance.
Table 6-3: MANE-VU PM2.5 Modeling Performance Goals
Fractional Bias | Fractional Error | Comment |
<±15% | <35% | Ozone model performance goal for which PM2.5 model performance would be considered good. |
<±30% | <50% | A level of model performance that we would hope each PM2.5 species could meet. |
<±60% | <75% | At or above this level of performance indicates fundamental problems with the modeling system. |
It does not mean that these performance goals should be generally adopted or that they are the most appropriate goals to use. Rather, the goals are being used to frame and put the PM2.5 model performance into context and to facilitate model performance across episodes, species, models and sensitivity tests.
As noted in EPA’s PM2.5 modeling guidance, less abundant PM2.5 species should have less stringent performance goals. Accordingly, performance goals that are a continuous function of average observed concentrations such as those proposed by Dr. James Boylan at the Georgia Department of Natural Resources have the following features:
The above goals and criteria are not regarded as a pass/fail test, but rather as a basis of inter-comparing model performance across studies, sensitivity tests and models.
The OTC model performance evaluation was initially conducted by NYSDEC on the summer ozone season data only. VADEQ has extended the evaluation to include the entire year of 2002 observations. Four statistical parameters, two recommended by EPA (Table 6.2) and two adopted by VISTAS (Table 6.3), pertinent to model performance evaluation were computed for FRM PM2.5 mass and for individual species of SO4, NO3, NH4, EC, OM (1.8* blank-corrected OC), soil or crustal material (sum of oxides of Ca, Fe, Si, and Ti). The statistics were organized into two categories: a) by date and b) by site.
For statistics by date, the parameters were calculated on a given day for any valid pairs of observed/predicted data across all FRM and speciation monitors that fall within the OTR modeling domain plus all of Virginia monitors (referred to as OTR+). Data collected from three different monitoring networks, FRM, STN, and IMPROVE, were used in the statistics. It is important to note that predicted data used for the model performance evaluation were extracted from CMAQ outputs at the exact grid cells where monitors are located. This is in contrast to the design value calculations where predictions are based on the average of the surrounding nine grid cells (see Section 6.5).
For statistics by site, parameters were computed at a given FRM, STN, or IMPROVE monitor for any valid pairs of observed/predicted data over a period of one calendar year. Again, the full year of 2002 data was used in this “monitor-based composite period" analysis, except for the dates between July 6 and July 9 due to the exceptional event caused by the Quebec forest fires.
Figure 6-3 depicts the location of the FRM, STN and IMPROVE monitor locations used for the model evaluation across the OTR+ region.
Figure 6-3: FRM ( 264), STN 50), and IMPROVE ( 21)
Locations Used for the Model Evaluation Across the OTR+ Region
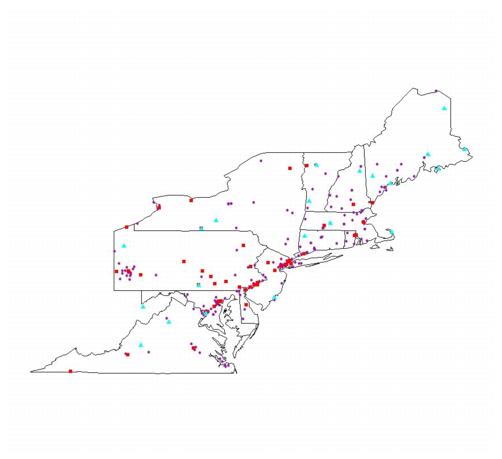
A composite FRM time series across the OTR+ region (264 monitors) is provided in Figure 6-4. This figure indicates that there is an overall mean bias of approximately 4 µg/m3. There is a general over-prediction during winter months and an under-prediction during summer months. There is excellent agreement during the mid-August air pollution episode.
Figure 6-4: Composite FRM Time Series across the OTR+ Region (264 monitors)
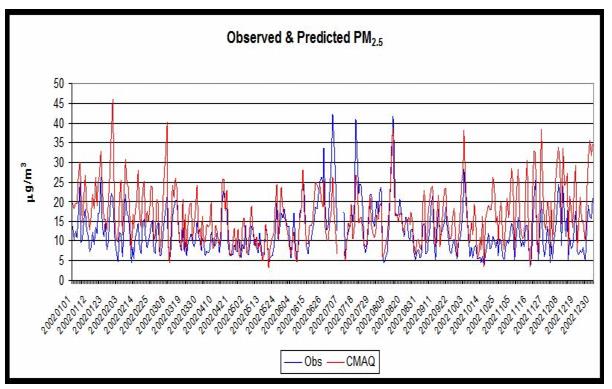
Figure 6-5 is a plot of the FRM mean fractional error (MFE) and mean fractional bias (MFB) across the OTR+ region. MFE ranges from 17% to 88% with an average of approximately 45%. MFB ranges from -82% to +88% with an average of approximately +24%. These values are generally consistent with similar studies listed in the Guidance on the Use of Models and Other Analyses for Demonstrating Attainment of Air Quality Goals for Ozone, PM2.5, and Regional Haze (EPA-454/B-07-002, April 2007).
Figure 6-5: MFE and MFB Time Series for FRM PM2.5 across the OTR+ Region
An MFE bugle plot for FRM PM2.5 across OTR+ region is provided in Figure 6-6. “Goal” curves are the best a model can be expected to achieve while the “criteria” curves are considered acceptable for model performance. 258 of 264 sites satisfy “criteria” restriction on an annual average basis.
Figure 6-6: MFE Bugle Plot for FRM PM2.5 across OTR+ Region
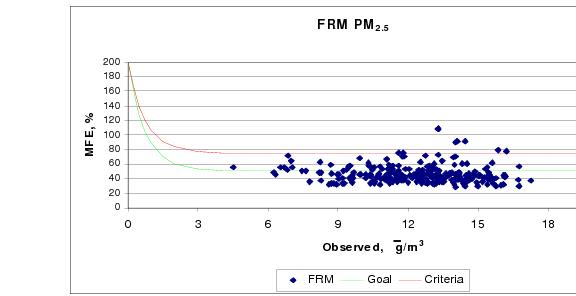
MFE bugle plots were also generated for SO4, NO3, and NH4, EC, OM, and soil/crustal across OTR+ region and are provided in Figures 6-7 through 6-12. As can be seen from the results, the performance for individual species is generally consistent with the criteria necessary for acceptable model performance.
Figure 6-7: MFE Bugle Plot for SO4 across OTR+ Region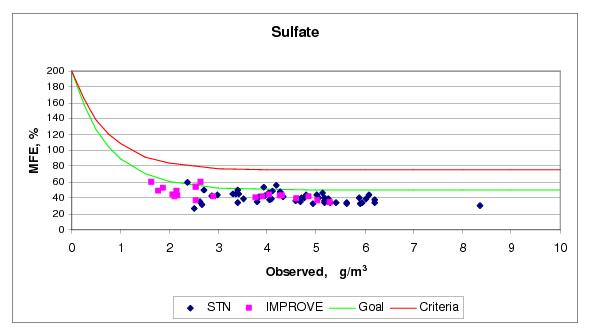
Figure 6-8: MFE Bugle Plot for NO3 SO4 across OTR+ Region
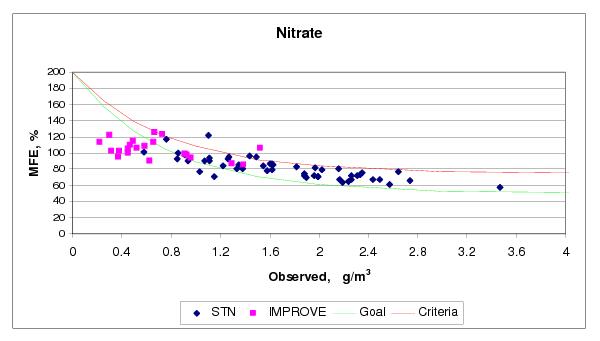
Figure 6-9: MFE Bugle Plot for NH4 across OTR+ Region


Figure 6-11: MFE Bugle Plot for OM across OTR+ Region
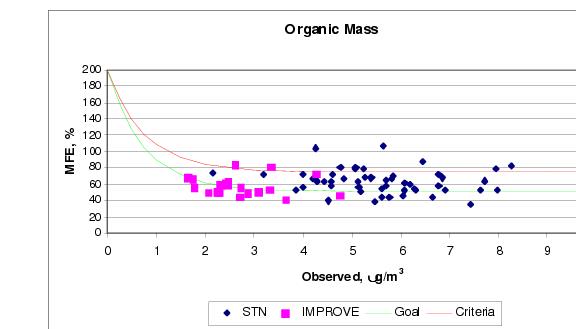
Figure 6-12: MFE Bugle Plot for Soil/Crustal across OTR+ Region
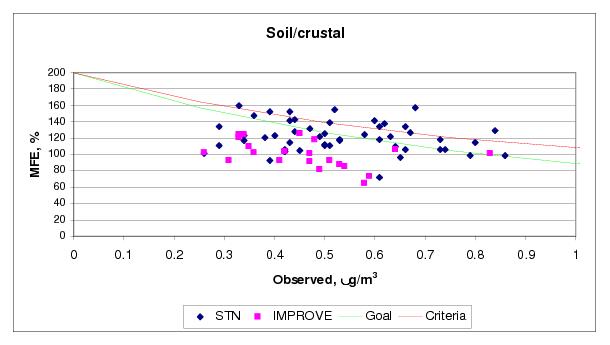
The following is a list of several PM2.5 statistics for the OTC domain that have also been provided in Appendix 6-4 and 6-4a.
1. Statistical evaluation of daily average PM2.5 mass from FRM sites across the OTR+ domain. Statistics are computed by date and by site (across the OTR+). [Figure 6-4, Figure 6-5 (by date). Figure 6-6 (by site).]
2. Statistical evaluation of daily average PM2.5, SO4, NO3, NH4, EC, OM, and crustal/soil mass at EPA STN sites. Statistics are computed by date and by site (across the OTR+). [Figure 6-7 to Figure 6-12 (by site).]
3. Statistical evaluation of daily average PM2.5, SO4, NO3, EC, OM, and crustal/soil mass at IMPROVE sites. Statistics are computed by date and by site (across the OTR+). [Figure 6-7 to Figure 6-12 (by site).]
4. Statistical evaluation of daily average PM2.5 mass from FRM sites. Statistics are computed by date and by site.
6.4.3 Summary of Model Performance
CMAQ was employed to simulate PM2.5 for the calendar year 2002. A review of PM2.5 and its individual species was conducted for the study domain.
The CMAQ model performance for surface PM2.5 is good with acceptable bias and error. Several observations can be made with respect to model performance, including the following:
1. Approximately 80-90% of OM is in the primary fraction. Observed OM has distinct maximum during summer when secondary formation is highest; CMAQ exhibits substantial under-prediction in secondary organic aerosols (SOA). The predicted primary OM is highest during the winter.
2. CMAQ captures seasonal variation in SO4 well.
3. CMAQ appears to overestimate primary PM2.5 components (EC, soil, primary OM), especially during colder months.
4. CMAQ appears to underestimate secondary OM during the summer.
These issues are not of great regulatory concern since attainment tests are based on the application of relative response factors. In summary, the regional and local model performance is acceptable for PM2.5. While there are some differences between the spatial data between sub-regions, there is nothing to suggest a tendency for the model to respond in a systematically different manner between regions. Examination of the statistical metrics by sub-region confirms the absence of significant performance problems arising in one area but not in another, building confidence that the CMAQ modeling system is operating consistently across the full OTC domain. This confidence in the modeling results allows for the modeling system to be used to support the State Implementation Plan to meet the 24-hour and annual PM2.5 NAAQS.
6.5 Attainment Demonstration
6.5.1 Overview
As previously mentioned, the PA-NJ-DE PM2.5 nonattainment area has an attainment date of April 5, 2010. The PM2.5 NAAQS include an annual standard of 15 ìg/m3 based on the 3-year average of annual mean PM2.5 concentrations, and a 24-hour standard of 65 ìg/m3 based on the 3-year average of the 98th percentile of 24-hour concentrations.
This section summarizes the procedures that are used to demonstrate attainment of the PM2.5 NAAQS. As described in EPA’s Guidance on the Use of Models and Other Analyses for Demonstrating Attainment of Air Quality Goals for Ozone, PM2.5, and Regional Haze (EPA-454/B-07-002, April 2007), an attainment demonstration consists of (a) analyses which estimate whether selected emissions reductions will result in ambient concentrations that meet the NAAQS, and (b) an identified set of control measures which will result in the required emissions reductions. The necessary emission reductions for both of these attainment demonstration components may be determined by relying on results obtained with air quality models.
EPA guidance recommends applying a modeled attainment test to the air quality modeling results to determine if the PM2.5 NAAQS will be met. Additional technical or corroboratory analyses may also be used as part of a “supplemental analysis” or a more stringent “weight of evidence” determination to supplement the modeled attainment test and to further support a demonstration of attainment of the NAAQS.
The modeled attainment test and additional corroborative analyses are described in further detail in the remaining portions of this section.
6.5.2 Model Attainment Test
The purpose of a modeling assessment is to determine if control strategies currently being implemented (“on the books”) and proposed control strategies will lead to attainment of the NAAQS for PM2.5 by the attainment year of 2009. The modeling is applied in a relative sense, similar to the 8-hour ozone attainment test. However, The PM2.5 attainment test is more complicated and reflects the fact that PM2.5 is a mixture. In the test, ambient PM2.5 is divided into major components, with a separate relative response factor (RRF) and future design value (DVF) calculated for each of the PM2.5 components. Since the attainment test is calculated on a per species basis, the attainment test for PM2.5 is referred to as the Speciated Modeled Attainment Test (SMAT). The following sections outline the process to determine that 2009 projections of PM2.5 will meet the NAAQS from regional modeling, as suggested in EPA’s modeling guidance.
6.5.2.1 Determine Baseline Design Values
The first step in any attainment test process is to determine the baseline design value (DVB). EPA guidance recommends using a DVB that is the average of the three design value periods that straddle the baseline inventory year (i.e., the average of the 2000-2002, 2001-2003, and 2002-2004 design value periods for a 2002 baseline inventory year). This works out to a 5-year weighted average, with the baseline year having the heaviest weight (i.e., {[2000] + 2*[2001] + 3*[2002] + 2*[2003] + [2004]}/9).
For the SMAT process, a mean PM2.5 DVB is determined, as well as component specific DVB for each quarter. The following section will detail the calculation of baseline design values needed for the PM2.5 attainment test.
Mean PM2.5 Baseline Design Values
To begin the SMAT process, a mean PM2.5 DVB is calculated on a quarterly basis for each Federal Reference Method (FRM) monitor in the PM2.5 nonattainment areas. Concentrations are calculated based on calendar quarters (Q1: January - March; Q2: April - June; etc.) as the NAAQS is calculated for a calendar year, and the quarters need to fit evenly within a year. Also, calculating the attainment test on a quarterly basis allows states to examine the differences in PM2.5 composition that occur during the different seasons.
Speciated Baseline Conditions
The monitored attainment test for PM2.5 utilizes both PM2.5 and individual PM2.5 component species. A separate RRF is calculated for each PM2.5 species. In order to perform the recommended modeled attainment test, States should divide observed mass concentrations of PM2.5 into 7 components (plus passive mass):
1. Mass associated with sulfates (SO4)
2. Mass associated with nitrates (NO3)
3. Mass associated with ammonium (NH4)
4. Mass associated with organic carbon (OC)
5. Mass associated with elemental carbon (EC)
6. Mass associated with particle bound water (PBW)
7. Mass associated with “other” primary inorganic particulate matter (Crustal)
8. And passively collected mass or the mass of the blank filter
The second part of the process is to use the quarterly mean PM2.5 DVBs with speciated data to calculate the quarterly mean concentrations of these 7 components at the FRM sites. This need to speciate the FRM data presents two issues:
1. FRM measurements and speciated PM2.5 measurements do not always measure the same mass.
2. Not all FRM monitoring sites have co-located STN speciation monitors.
The following sections will explain how these issues were overcome to produce the speciated values needed for this attainment demonstration.
SANDWICH
As EPA guidance notes, recent data analyses have noted that the FRM monitors do not measure the same components and do not retain all of the PM2.5 that is measured by routine speciation samplers and therefore cannot be directly compared to speciation measurements from the Speciation Trends Network (STN). By design, the FRM mass measurement does not retain all ammonium nitrate and other semi-volatile materials (negative sampling artifacts) and includes particle bound water associated with sulfates, nitrates and other hygroscopic species (positive sampling artifacts). This results in concentrations (and percent contributions to PM2.5 mass), which may be different than the ambient levels of some PM2.5 chemical constituents.
To resolve the differences between FRM and STN total mass, EPA recommends using the “sulfate, adjusted nitrate, derived water, inferred carbonaceous material balance approach” or SANDWICH approach. With the SANDWICH approach, nitrate mass is adjusted to account for volatilization based on hourly meteorology parameters. Subsequently, quarterly average nitrate, sulfate, elemental carbon, and crustal mass can be calculated, as well as the Degree of Neutralization (DON) of sulfates. Quarterly average NH4 can then be calculated from the adjusted nitrate mass, sulfate mass, and DON of sulfate. Next the mass of particle bound water can be calculated from the previously obtained DON, sulfate, nitrate, and ammonium values. Finally, organic carbon is calculated by taking the difference between the total PM2.5 mass as measured at the FRM monitor, and the calculated component mass (i.e., OC from mass balance ([OCMmb] = PM2.5FRM:{[EC] + [SO4] + [NO3] + [NH4] + [water] + [crustal material] + [passive mass]}), where the passive mass is the FRM sampling artifact normally set equal to 0.5}.
To allow for simple presentations and analyses, however, SANDWICH data can also be presented by major components of PM2.5 mass. In this approach, water and nitrates are combined with [SO4] and [NO3]. Then the FRM and STN masses are reconciled by: PM2.5= [SANDWICH sulfate mass] + [SANDWICH nitrate mass] + [SANDWICH TCMmb] + [SANDWICH Crustal Mass] + [Passive mass]. EPA Region 3 office provided SANDWICHed data for all monitors in the PA-NJ-DE PM2.5 nonattainment area. For a description and use of the SANDWICH method see the EPA documents (Appendix C).
Speciated Profiles
While the SANDWICH method reconciles the differences between FRM and STN, a lingering issue is that not all FRM monitoring sites have co-located STN monitors to provide speciated data. EPA guidance suggests four measures that can be taken to resolve the lack of speciated data:
1. Use of concurrent data from a near by speciated monitor
2. Use of representative data (from a different time period)
3. Use of interpolation techniques to create a spatial field using ambient speciation data
4. Use of interpolation techniques to create spatial fields, and gridded modeling outputs to adjust the species concentrations
Of the four methodologies, the EPA recommends using one of the spatial interpolation techniques to estimate species concentrations at FRM sites that do not have speciation data (numbers 3 and 4 above). To assist in this task, the EPA is developing a software tool called “Modeled Attainment Test Software” (or MATS) that will perform the spatial analysis of described options number 3 and 4. However, the MATS tool is not available at this time. In trying to pursue the EPA recommended course of action, option 1, that is, use of concurrent data from a nearby speciated monitor is utilized.
6.5.2 Relative Response Factor Calculations
The calculation of relative response factors (RRFs) for this study was performed using the EPA recommended method for “nearby” grid cells for a 12-kilometer horizontal grid resolution, with a 3x3 grid cell array for 12-km resolution modeling. The relative response factor used in the modeled attainment test is computed by taking the ratio of the mean of the predictions in the future to the mean predictions with baseline emissions, over all relevant days.
For the 24-hour and annual PM2.5 NAAQS, the spatially averaged value of the nearby predictions (mean value of the grid cell array) was used. Each component-specific RRF was used in the modeled attainment test by taking the ratio of the mean of the spatially averaged daily predictions in the future to the mean of the spatially averaged daily predictions with current emissions.
The basis for this approach is as follows:
1. Consequence of a control strategy may be “migration” of a predicted peak. If a State were to confine its attention only to the cell containing a monitor, it might underestimate the RRF (i.e., overestimate the effects of a control strategy).
2. Uncertainty in the formulation of the model and the model inputs is consistent with recognizing some leeway in the precision of the predicted location of concentrations.
3. Standard practice in defining a gridded modeling domain is to start in the southwest corner of the domain, and determine grid cell location from there. Considering several cells “near” a monitor rather than the single cell containing the monitor diminishes the likelihood of inappropriate results which may occur from the geometry of the superimposed grid system.
4. The area does not exhibit strong spatial concentration gradients of observed primary PM2.5.
6.5.3 Annual SMAT Results
Table 6-4 presents the results of the annual SMAT results for the PA-NJ-DE nonattainment area. The SMAT results demonstrate that the projected average annual arithmetic mean PM2.5 concentration calculated at each FRM monitor attains the annual PM2.5 NAAQS. Specifically, all future design value (DVF) calculations are less than15 ìg/m3. Table 6-4 presents the results of the annual SMAT results for a suite of regional modeling runs conducted by OTC each representing OTB/OTW – “On the Books, On the Way” control measures. All runs demonstrate compliance with the annual NAAQS.
Table 6-4: Annual SMAT Results for PA-NJ-DE Nonattainment Area
2009 On-The-Books-On-The-Way Control Measures
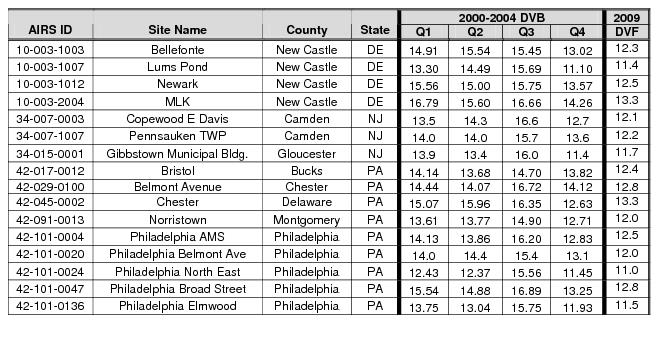
6.5.4 24-Hour SMAT Results
Table 6-5 presents the results of the 24-hour SMAT results for the PA-NJ-DE nonattainment area. Some difficulties presented in estimating the future design values include - missing FRM data for 2000 and 2001 at some monitors and the limitation of the SANDWICH data provided by Region 3 office to the period 2002–2004. Therefore, the 2009 projected design values are for the period 2002-2004. The SMAT results demonstrate that the projected average annual arithmetic mean PM2.5 concentration calculated at each FRM monitor attains the 24-hour PM2.5 NAAQS. All future design value (DVF) calculations are well below 65 ìg/m3.
Table 6-5: 24-Hour Modeling Attainment Test Using EPA SMAT Methodology
2009 On-The-Books/On-The-Way Control Measures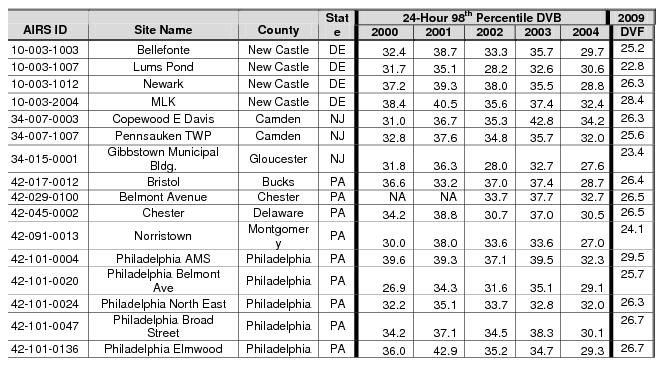
6.6 Unmonitored Area Analysis
The modeled attainment test does not address future air quality at locations where there is not a PM2.5 monitor nearby. To guard against the possibility that air quality levels could exceed the standard in areas with limited monitoring, EPA suggests that additional review is necessary, particularly in nonattainment areas where the PM2.5 monitoring network just meets or minimally exceeds the size of the network required to report data to Air Quality System (AQS). This review is intended to ensure that a control strategy leads to reductions in PM2.5 and its constituent pollutants at other locations that could have baseline (and future) design values exceeding the NAAQS were a monitor deployed there. The test is called an “unmonitored area analysis”. The purpose of the analysis is to use a combination of model output and ambient data to identify areas that might exceed the NAAQS if monitors were located there.
It is important to note that Delaware currently operates a network of six PM2.5 monitors. Four of these monitors are in New Castle County, which is part of the PA-NJ-DE nonattainment area. Some of these monitors were established as State and Local Air Monitoring Stations (SLAMS). These SLAMS monitors were selected based on specific monitoring objectives (background concentration, area of highest concentration, high population, source impact, transport, and rural impact) as required by EPA and siting scales (micro, middle, neighborhood, urban, and regional) established by EPA.
It is believed that the density of the monitoring network in New Castle County relieves the necessity of applying this additional analysis. Despite being confident the monitoring network is robust enough to cover the New Castle County, once the final version of the MATS tool has been released, and after sufficient peer review and proper guidance documentation for the analysis of the results is provided, the TAC Modeling Committee will evaluate the MATS tool output. However, we present here a geostatistical spatial analysis that shows attainment of the PM2.5 NAAQS for the entire PA-NJ-DE nonattainment area.
The geostatistical spatial analysis extends the projected design values at the monitors by interpolating them to provide spatial fields in the monitored and unmonitored areas. The spatial fields will provide an indication of concentrations in monitored and unmonitored areas. But a simple interpolation of the data cannot identify unmonitored areas with higher concentrations than those projected at the monitors. The interpolated concentration between monitors will generally be the same or lower than the projected concentration at the monitors unless more sophisticated statistical techniques, such as adding a nugget effect or a trend surface, are used.
The geostatistical spatial analysis that we adopted here calculates empirical variograms that provide distances and the estimated semi-variances. Theoretical and empirical variograms can be plotted and visually compared. Theoretical variograms are computed by parameter estimation by some methods, such as the maximum likelihood (ML), restricted maximum likelihood (REML), ordinary and weighted least squares (OLS & WLS), Bayesian kriging, etc. When using the parameter estimation the nugget effect can either be estimated or set to a fixed value. The same applies to smoothness, anisotropy and transformation parameters. Options for taking trends into account are also accounted for by specifying polynomial functions of the coordinates and/or linear functions of given covariates. Conventional spatial interpolation, i.e. kriging, can be performed with options for – simple kriginng, ordinary kriging, trend (universal) kriging, external trend kriging, etc. Additional options can be provided by Box-Cox transformation, back transformation of the results, and anisotropic models. Simulations can be drawn from the resulting predictive distributions covering the domain. Bayesian analysis for Gaussian models can be performed for different degrees of uncertainty.
First, we present here geostatistical spatial analysis for the annual standard and show that the standard is met everywhere in the nonattainment area. Projected design values at the monitors in the PA-NJ-DE nonattainment area form the basis of this analysis. Theoretical and empirical variograms can be plotted and visually compared. When using the parameter estimation for the theoretical variograms, the nugget effect can either be fixed or estimated. Figure 6-13 shows how empirical variograms can be fitted with different models with the options of fixed or estimated nugget parameter. Next a model that fits the data can be chosen to predict on a grid covering the area that may or may not include the nugget effect. However, ordinary kriging, without the sophisticated statistical techniques such as adding the nugget effect or a trend surface, would interpolate the concentrations between the monitors to generally lower or the same as projected design values at the monitors. Therefore, we performed the prediction with the nugget effect set to 0.15 and the weighted least squares (WLS) model. The resulting map Figure 6-14 shows that the entire PA-NJ-DE nonattainment area will attain the annual standard; furthermore, it shows somewhat elevated concentrations in the northern portion of the PA-NJ-DE nonattainment area than the southern portion; this is in agreement with the monitoring data in the PA-NJ-DE NAA.
Figure 6-13: Empirical variogram fitted with different models for the annual standard
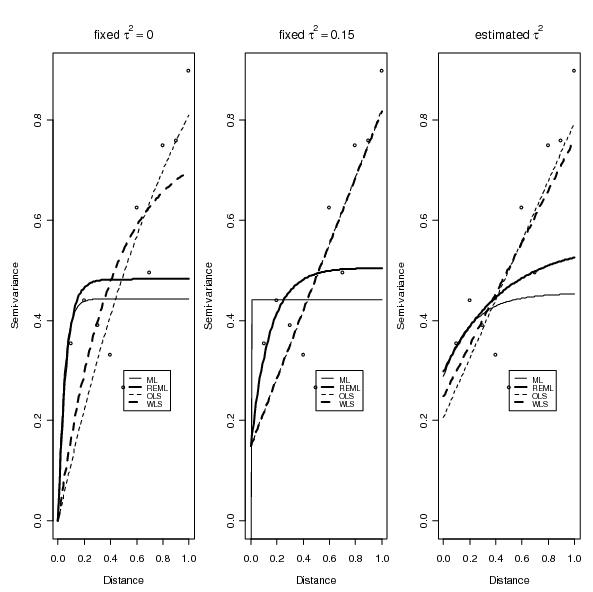
Figure 6-14: Map of kriging estimates for the annual standard fitted with weighted least squares model and nugget set to 0.15

Next, we consider the same approach for the daily standard and show that the standard is met everywhere in the PA-NJ-DE nonattainment area. Figure 6-15 shows the effect of fitting the empirical variogram with different models with the options of fixed or estimated nugget parameter. Figure 6-16 shows a map for the entire PA-NJ-DE NAA for the daily standard that results from predicting with the WLS model and nugget effect set to 0.15. The figure shows the entire PA-NJ-DE NAA will attain the daily standard.
Figure 6-15: Empirical variogram fitted with different models for the daily standard
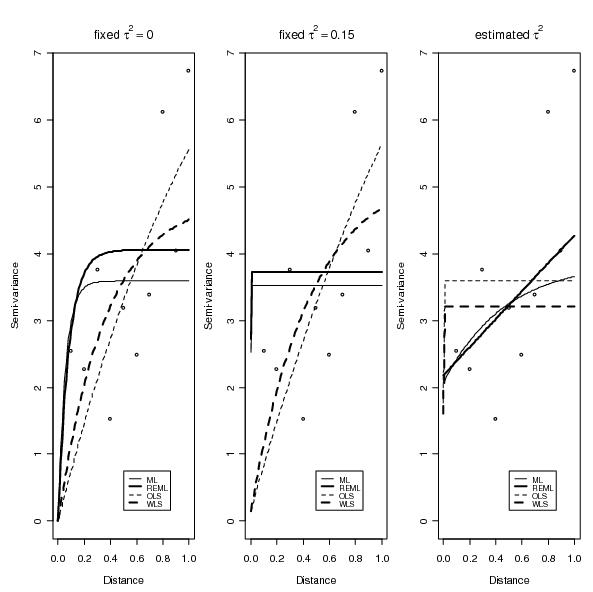
Figure 6-16: Map of kriging estimates for the daily standard fitted with weighted least squares model and nugget set to 0.15
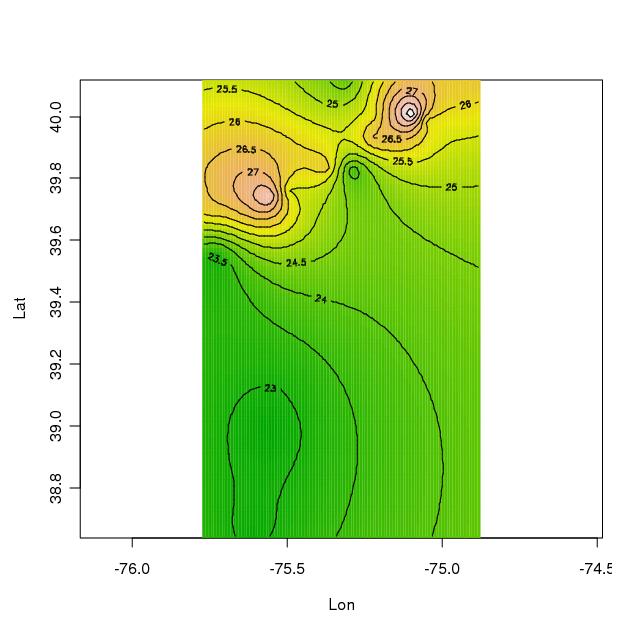
6.7 Local Area Analysis
Base on review of final EPA modeling guidance, the local area analysis is designed to identify local primary PM2.5 sources that are thought to be contributing to a monitor and causing non-attainment of the NAAQS. At this time, no monitors within the PA-NJ-DE nonattainment area are projected to exceed the NAAQS so it does not appear to be a necessary requirement in this circumstance to conduct the local area analysis. Furthermore, existing monitoring data suggests a uniform regional pattern with respect to PM2.5 concentrations rather than any “hot spot” monitor.
6.8 Supplemental Analyses and Weight of Evidence Determination
All models, including the CMAQ, model have inherent uncertainties. Over or under prediction may result from uncertainties associated with emission inventories, meteorological data, and representation of PM2.5 chemistry in the model. Therefore, EPA modeling guidance provides for other evidence to address these model uncertainties so that proper assessment of the probability to attain the applicable standards can be made.
EPA modeling guidance states that those modeling analyses that show that attainment with the NAAQS will be reached in the future with some margin of safety (i.e., estimated concentrations below 14.5 ìg/m3 for annual PM2.5 and 62 ìg/m3 for 24-hour PM2.5) need more limited supporting material.
Due to the fact that the modeling results presented in Tables 6-4 and 6-5 fall well below the aforementioned “weight of evidence” thresholds established by EPA, a limited supplemental analysis was deemed necessary to support the 2009 attainment demonstration.
Trends in PM2.5 Design Values
Figure 6-17 below show trends for the period 2000-2006 in annual PM2.5 design value for all monitors in the PA-NJ-DE NAA including the monitors in Kent and Sussex Counties. It is clear from this figure that all the monitors show a downward trend in the annual PM2.5 design value. It is noteworthy that 2004-2006 design values at all monitors, with the exception of Chester monitor, already met the annual PM2.5 standard.
Figure 6-17. Trend in Annual PM2.5 Design Values (2000 through 2006)
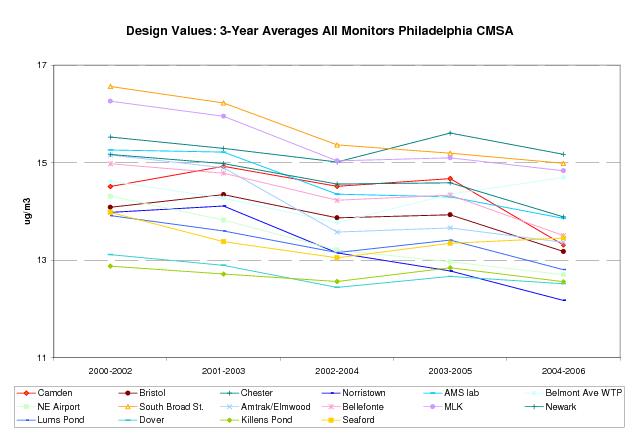
Figure 6-18 below show trends for the period 2000 - 2006 in daily PM2.5 design value for all monitors in Delaware nonattainment area including the monitors in Kent and Sussex Counties. It is clear from this figure that all the monitors show a downward trend in the daily PM2.5 design value. It is noteworthy that the at all monitors already met the daily standard in 2006; they also met the new daily PM2.5 standard (35 µg/m3) with the exception of Camden, South Broad Street, and MLK.
A downward trend in both annual and daily PM2.5 design values indicate that the control measures implemented during this period have been providing PM2.5 reduction benefits. With more controls anticipated in coming years, this trend is expected to continue.
Figure 6-18. Trend in Daily PM2.5 Design Values (2000 through 2006)
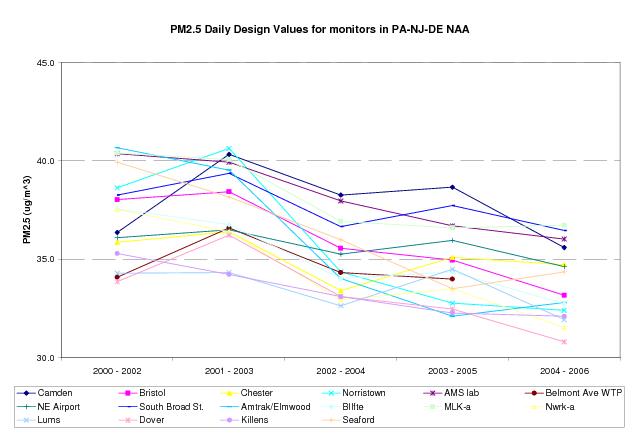
6.9 Conclusions
The results from the modeling as well as the supplemental analyses present overwhelming evidence that the PA-NJ-DE nonattainment area will attain the 24-hour and annual PM2.5 NAAQS by April 5, 2010. Based on air quality measurements and future predicted air quality modeling results the projected design values are below the NAAQS attainment criteria of 15.0 ìg/m3 for annual PM2.5 and 65 ìg/m3 for 24-hour PM2.5.
7.1 Background and Requirements
This section discusses Reasonably Available Control Measures (RACM) and Reasonably Available Control Technology (RACT) for sources of pollutants regulated under this SIP (i.e., primary fine particulate matter (PM2.5), nitrogen oxides (NOx) and sulfur dioxide (SO2))14.
In accordance with Section 51.1010 of the PM2.5 Implementation Rule15, “the State shall submit with the attainment demonstration a SIP revision demonstrating that it has adopted all reasonably available control measures (including RACT for stationary sources) necessary to demonstrate attainment as expeditiously as practicable and to meet any RFP requirements. The SIP revision shall contain the list of the potential measures considered by the State, and information and analysis sufficient to support the State’s judgment that it has adopted all RACM, including RACT.
For primary PM2.5 RACM, the Department evaluated measures which would be limited to the boundaries of the non-attainment area, i.e. New Castle County. However, because SO2 and NOx can be transported over considerable distances to form PM2.5, they were assessed on a state-wide basis (see Appendix 7-1 for EPA List of Control Measures evaluated). Also, while not specifically regulated under this SIP, several VOC measures are discussed in this section, as they are included in the modeling associated with this attainment demonstration.
7.2 Post-2002 RACT and RACM Measures
Since 2002, Delaware and EPA have implemented numerous measures that have resulted in NOx, SO2 and PM2.5 reductions throughout the State. These measures represent RACM/RACT, and in some cases, requirements that go beyond RACM/RACT requirements, and will result in more than a 50% reduction in overall emissions between 2002 and 2009. Years 2002 and 2009 are compared, by county, in Table 7-1 below.
Table 7-1 DE 2002 and Projected 2009 Emissions
County | NOx | PM2.5 | SO2 | |||
2002 | 2009 | 2002 | 2009 | 2002 | 2009 | |
Kent | 10,314 | 7799 | 1097 | 989 | 4,062 | 3664 |
New Castle | 30,748 | 21,807 | 3430 | 3015 | 50,237 | 14135 |
Sussex | 16060 | 11591 | 2575 | 2571 | 25,552 | 11724 |
Totals | 57,122 | 41,197 | 7,102 | 6,575 | 79,852 | 29,523 |
Sections 7.2.1 through 7.2.5 present a listing of these post-2002/pre-2010 state and federal measures that fulfill Delaware’s RACT/RACM obligations.
7.2.1 Point Sources:
7.2.2 Non-Point Sources:
7.2.3 Non-Road Sources:
7.2.4 On-Road Mobile
7.2.5 Other Measures
Delaware has implemented many other SO2, NOx, VOC and PM2.5 control measures. These measures include mandatory episodic prohibition of lightering on ozone action days (Reg. 1124, Section 36), and reduction of emissions from high electric demand day electric generation (Reg. 1146 and Reg. 1148). Other voluntary measures that will take effect by 2010 include:
7.3 Additional RACM/RACT Evaluation
Delaware’s attainment date for the annual NAAQS is April 2010166. However, states are required to demonstrate attainment as expeditiously as practicable, which would be at least one year earlier than the attainment year, e.g. April, 2009. Attainment by April 2009 would be based on ambient air PM2.5 concentrations
in calendar years 2006, 2007, and 2008, so in order to attain at least one year early adequate emission reductions would need to occur, at the latest, by January 2008.
Section 6 of this SIP demonstrates the CMAQ modeled emission levels that are consistent with attainment; emission levels higher than these levels are not adequate to attain. Statewide CMAQ modeled Delaware emissions levels for the pollutants regulated under this SIP are:
Table 7-2 CMAQ Modeled 2009 Emissions, Delaware
SO2 | PM2.5 | NOx |
42,569 | 8,014 | 49,602 |
In order to demonstrate attainment in 2009, Delaware’s 2008 emissions would need to be at or below the levels specified in Table 7-1. The following analysis demonstrates that Delaware has adopted RACT/RACM and beyond RACT/RACT measures (i.e., the measures identified in Section 7.2 above) that demonstrate attainment as expeditiously as practicable, and that advancement of the attainment date to April 2009 or earlier is not feasible.
1.) Many of the adopted control measures detailed in 7.2 above do not go into full effect until 2009. One significant Delaware measure is Regulation No. 1146, EGU Multi-pollutant Regulation. The approximate quantity of Delaware 2009 reductions that will not occur in 200817 as a result of Reg. 1146 not being effective in 2008 are detailed in Table 7-3:
Table 7-3 2009 Statewide Emission Reductions attributable to Delaware Reg. 1146 (TPY)
SO2 | PM2.5 | NOx |
19,229 | -21818 | 3,147 |
2.) As indicated in table 7-3, Regulation No. 1146 is a significant control measure for SO2 and NOx. It is not possible to advance the compliance date of Regulation No. 1146 from 2009 to 2008; it was determined during the regulatory adoption process that the earliest feasible compliance date of Reg. 1146 was 2009. Conservatively assuming that all other planned 2009 reductions, other than Reg. 1146, would occur by 2008 Delaware’s 200819 emission projection would be:
Table 7-4 2008 Emissions Projection**, Conservatively Low Estimate
SO2 | PM2.5 | NOx |
48,752 | 6,357 | 44,344 |
** Sum of Table 7-1 and 7-3.
17. Delaware's Multi-Pollutant regulation (Reg. 1146) does not go into effect until 2009
18. Reg. 1146 did not specifically address direct PM2.5 emissions, so 2009 PM2.5 emissions are projected to increase between 2002 and 2009 due to growth. Actual control technology installed to meet Reg. 1146 NOX, SO2, and Hg emission limitations may result in changes in PM2.5 emission rates, but such changes are not required by Reg. 1146
19. This is a conservatively low estimate, as many measures (e.g., on-road mobile) gain reductions as time goes forward due to factors such as fleet turnover. Delaware's actual 2008 emissions would likely be higher than this estimate.
3.) Comparison of Tables 7-2 and 7-4 indicates that implementation of RACT/RACM and beyond RACT/RACM controls in Delaware may result in Delaware’s 2008 emission levels being below the levels that are consistent with attainment relative to both direct PM2.5 and NOX, but that they will be at least 6,183 TPY high relative to SO2 .
4.) Step 3 above indicates that in order for Delaware to do its part in advancing the attainment date to April 2009 it would need to further reduce SO2 emissions by at least 6,183 TPY by the beginning of 2008. To determine if this was possible, Delaware sorted its entire SO2 inventory from highest emitting source to lowest emitting source, and developed a list that identifies the source categories that cover 95% of Delaware’s overall SO2 emissions. That list is presented in Table 7-5.
Table 7-5 Delaware SO2 Emissions, Source Categories Covering 95% of Total Emissions
Source Description | Source Sector | 2002 | 2009 |
Combined Distillate Oil Combustion Total | Point & Nonpoint | 1,333 | 1,288 |
EGU Boiler - Bituminous/Subbituminous Coal Total | Point | 27,712 | 8,954 |
EGU Boiler - Residual Oil Total | Point | 5,280 | 3,270 |
ICI Boiler - Bituminous/Subbituminous Coal Total | Point | 4,824 | 5,606 |
ICI Boiler - CO Boiler Total | Point | 29,748 | 537 |
ICI Boiler - Residual Oil Total | Point | 2,891 | 3,846 |
Industrial Processes - Fluid Coking Unit Incinerator 20 | Point | 1,133 | 1,045 |
Marine Vessels, Commercial - Diesel - Underway emissions Total | Nonroad | 1,255 | 269 |
Marine Vessels, Commercial - Residual - Underway emissions Total | Nonroad | 2,025 | 2,248 |
Totals = | 76,201 | 27,062 | |
Complete Inventory Totals = | 79,852 | 29,525 | |
% of Complete Inventory = | 95.4% | 91.7% |
The four (4) source categories that are highlighted in Table 7-5 are those that have not been controlled, relative to SO2, by post-2002 control measures. These are the source categories, that are projected to emit 11,785 TPY of SO2 in 2009, which Delaware could theoretically control to advance the attainment date (i.e., Delaware would need to reduce this 11,785 TPY of SO2 by at least 53% by 2008). Delaware is currently evaluating and developing measures to reduce SO2 emissions from these three categories as regional measures, but such actions will not be complete by and effective by 2008.
20. This is emission release point an incinerator, i.e. control device, which only emits when the scrubber on the CO Boiler shuts down (unplanned).
Further, Delaware does not believe advancement of the attainment date to April 2008 in the Philadelphia CMSA is possible for the following additional reasons:
In summary, Delaware’s Regulation No. 1146 is a significant control measure in this SIP. Regulation No. 1146 reductions will not occur until 2009, and while Delaware has, and continues to evaluate additional SO2, NOX, and PM2.5 control measures, there are not enough emissions under Delaware’s control to cover with early control requirements to compensate for Reg. 1146 not being effective until 2009. Further, the timing of the development of emission controls for these other categories is not consistent with early attainment (i.e., reductions are not possible in 2008). Based on this Delaware has demonstrated that attainment by April 2010 is as expeditiously as practical, and that it has implemented sufficient RACM/RACT control requirements.
8.1 Introduction to Transportation Conformity
Section 176 of the Clean Air Act requires that highway transportation projects funded or approved by the federal government conform to any applicable State Implementation Plan (SIP) adopted to provide for the attainment of any National Ambient Air Quality Standard. In general, this requirement specifies that (1) states establish, in their SIP, mobile source emission budgets for the attainment year, and submit the mobile budgets to EPA for approval, (2) upon adequacy determination or approval of EPA, states must conduct transportation conformity analysis for their Transportation Improvement Programs (TIPs) and long range transportation plans to ensure that future highway vehicle emissions will not exceed relevant mobile budgets, and (3) failure of demonstrating such transportation conformity in TIPs and long range plans will lead to conformity lapse(s), resulting in freezing of federal highway funds and all federal highway projects in the lapsed area.
8.2 Mobile Budgets for 2009, the Attainment Year
The mobile emissions budget 2009 attainment is based on the projected 2009 mobile source emissions, accounting for all relevant mobile source controls including all federal controls and Delaware specific controls as described in Section 4. The 2009 mobile emissions were projected using EPA’s MOBILE6.2 for obtaining emission factors and the “Peninsula Travel Demand Model” for predicting future vehicle miles traveled (VMT). The MOBILE6.2 runs were conducted by AQM’s staff using the most recently available vehicle registration data (2007), and projected speed estimates (2009). Examples of how to calculate the 2009 mobile emission projections are presented in Appendix 8-1.
8.2.1 Mobile Budgets for 2009 Attainment Year
Table 8-1 is a summary of 2009 mobile source emission projections for each pollutant, PM2.5 and NOx in New Castle County. PM2.5 is the criteria air pollutant that New Castle County is designated as being in non-attainment for. Pursuant to 40 CFR 93.102, a motor vehicle emission budget must be established for this pollutant.
In addition, precursor pollutants to PM2.5 must also be analyzed as to whether motor vehicle budgets must be established for these pollutants. These pollutants include volatile organic compounds, ammonia, sulfur dioxide, and nitrogen oxides. Table 8-1 illustrates the on-road mobile source fraction of the total 2009 inventory for each precursor pollutant.
Table 8-1 On-Road Mobile primary and Precursor PM2.5 Emissions as a Percent of Total Projected Inventory New Castle County
2009 | NOx | VOC | NH3 | PM2.5 | SO2 |
On-Road Mobile Source Projected Inventory | 4904 | 3466 | 610 | 87 | 51 |
Total Projected Emission Inventory | 21444 | 13887 | 1466 | 3015 | 14135 |
Percent of Total Projected 2009 Inventory | 22.9% | 25.0% | 41.6% | 2.9% | 0.4% |
NOx is the only precursor pollutant that must have a budget established, unless both the EPA Regional Administrator and the director of the state air agency have determined that transportation-related emissions of NOx within the non-attainment area are not a significant contributor to the PM2.5 non-attainment problem, and so notified the MPO and DOT, that the applicable implementation plan (or implementation plan submission) does not establish an approved (or adequate) budget for such emissions as part of the reasonable further progress or attainment.
Pursuant to 72 FR 20595 states must demonstrate that on-road mobile SO2 emissions are not inhibiting the states’ ability to attain the PM2.5 applicable standard. As Table 8.1 indicates above, on-road mobile SO2 emissions only accounts for 0.4% of the total New Castle County 2009 projected SO2 emissions. Except for NOx, the other precursor pollutants do not need a motor vehicle emissions budget unless either the state air agency director or the EPA Regional Administrator makes a finding that motor vehicle emissions budgets must be established in order to attain the NAAQS for PM2.5. No applicable finding has been made for any of the other precursor pollutants of PM2.5 and therefore the State Implementation Plan is only establishing motor vehicle emission budgets for PM2.5 and NOx.
This summary herein establishes New Castle County PM2.5 and NOx emission budgets as specified in Table 8-2 for the attainment year 2009.
Table 8-2 On-Road Mobile Source Emission Projections for 2009
Tons/Year
2009 | Emissions | |
New Castle | PM2.5 | NOx |
87 | 4904 |
Under subpart 1 of the CAA, all PM2.5 non-attainment areas must include in their SIPs contingency measures consistent with section 172(c)(9). Contingency measures are additional control measures to be implemented in the event that an area fails to either meet RFP or attain the standards by its attainment date.
These contingency measures must be fully adopted rules or control measures that are ready to be implemented quickly upon failure to meet RFP or failure of the area to meet the standard by its attainment date. States may also use as contingency measures one or more Federal or local measures that are in place and provide reductions that are in excess of the reductions required by the attainment demonstration or RFP plan.
9.1 Quantification of Contingency Reductions Required
The Rule requires that the quantity of emission reductions needed to satisfy contingency requirements is an amount equal to one year’s worth of required reductions. Required reductions are the amount of reductions needed to attain compliance with the PM2.5 NAAQS. 2002 emissions are the base year emissions (see section 3 of this Document), and the CMAQ modeled 2009 emissions are the emission levels that necessary for attainment (see Section 5 of this Document), so the difference between these emission levels is the total quantity of reductions required for attainment. Since there are seven years between 2002 and 2009, the total quantity of reductions required for attainment is divided by seven to determine 1-year’s worth of required reductions (i.e., the contingency requirement).
9.1.1 CMAQ Modeled 2009 Emissions, i.e. Attainment Targets
Table 5-1 shows the 2009 emission levels that are necessary for attainment (i.e., the attainment targets). The values of Table 5-1 are repeated in Table 9-1 below. These are the emission reductions accounted for in the CMAQ model, which showed attainment in 2010 for the Philadelphia CMSA (see Section 6 of this document for details).
Table 9-1 Attainment Targets (TPY)
Year | County | NOX | PM2.5 | SO2 |
2009 | New Castle | 23048 | 3249 | 12001 |
9.1.2 2002 Delaware Base Year
Table 9-2 shows Delaware’s 2002 base year emissions (see Section 3 of this document for details).
Table 9-2 Delaware 2002 Base Year
County | NOX | PM2.5 | SO2 |
New Castle | 30748 | 3430 | 50237 |
9.1.3 Contingency Requirement
Table 9-3 shows one year’s worth of required emission reductions (i.e., the amount required for contingency). This was calculated by subtracting the attainment targets (Table 9-1) from the 2002 base year (Table 9-2), and dividing the difference by 7 years.
Table 9-3 Contingency Requirement
County | NOX | PM2.5 | SO2 |
New Castle | 1100 | 26 | 5462 |
9.2 Demonstration that Contingency Requirement is Met
Table 9-4 shows Delaware’s projected 2009 emission levels for NOx and PM2.5 (see Section 4 of this document for details).
Table 9-4 Delaware 2009 Projection
County | NOX | PM2.5 |
New Castle | 21807 | 3015 |
Delaware shows that it has met the contingency requirement if the projected 2009 emission levels (Table 9-4) are lower than those needed for attainment (Table 9-1) by at least the amount of the contingency requirement (Table 9-3). Subtracting the amounts in Table 9-4 from the amounts in Table 9-1 shows that Delaware control measures have reduced NOx and primary PM2.5 by more than is necessary to attain compliance with the annual PM2.5 NAAQS. Specifically, emissions reductions of 1,241 NOx and 234 PM2.5 TPY have been made that are above and beyond that necessary for attainment. And, these excess reductions which are “in place and provide reductions that are in excess of the reductions required by the attainment demonstration or RFP plan” are greater than the contingency requirement of 1,100 NOx and 26 PM2.5 TPY (Table 9-3). This demonstrates that the contingency requirement has been met relative to the pollutants NOx and primary PM2.5.
The circumstances are dissimilar for SO2. Table 9-5 (taken from Table 5-4) indicates that there is an attainment shortfall of 2,134 TPY for SO2 in New Castle. However, because of several new regulations in place by 2010, and as discussed in Sections 4 and 6 of this document, Delaware has a statewide surplus 13,047 TPY of SO2.
Table 9-5 Contingency – SO2 “surplus and shortfalls”
CMAQ Modeled SO2 Inventory (TPY) | DE 2009 Projected SO2 Emissions (TPY) | SO2 Surplus/ Shortfall (TPY) | |
Kent | 2201 | 3664 | -1463 |
New Castle | 12001 | 14135 | -2134 |
Sussex | 28368 | 11724 | 16644 |
Total | 42569 | 29525 | 13047 |
The 13,047 TPY overall SO2 reductions are above and beyond those needed for attainment, e.g., since 13,047 TPY is greater than 5,462 TPY, Delaware has demonstrated that the contingency requirement relative to SO2 has been met.
A collection of the listed appendixes, stored on CD, is available upon request. Contact Delaware Department of Natural Resources and Environmental Control - Air Quality Management Section at 156 South State Street, Dover, DE 19901.
Appendix 4-1 Development of Emission Projections for 2009, 2012, and 2018 for Non-EGU Point, Area, and Non-road Sources in the MANE-VU Region, Draft Final Technical Support Document, Prepared for Mid-Atlantic Regional Air Management Association (MARAMA) by MACTEC Federal Programs, Inc., December 7, 2006.
Appendix 4-2 The 2009 Corrected Emission Projections of Delaware EGU, Non-EGU, Non-Point and Non-Road Mobile Sources.
Appendix 4-3 The 2009 Emission Projections for Delaware’s Point, Non-Point, Onroad, and Non-Road Mobile Sources.
Appendix 4-4 Part 1: MOBILE6.2 Input and Output Files for Delaware 2009 Mobile Source Emission
Part 2: Calculations of 2008 and 2009 On-Road Mobile Source Emission Projections
Appendix 6-1 The Nature of the Fine Particle and Regional Haze Air Quality Problems in the MANE-VU Region: A Conceptual Description (NESCAUM, November 2006) and
Appendix 6-2 The Development of PM2.5 Forecasting Tools for Selected Cities in the MARAMA Region (ICF, September 2004)
Appendix 6-3 The New York State DEC, Division of Air Resources, performance evaluation of the 2002 base case CMAQ simulation
Appendix 6-4/a Sandwich Method
Appendix 7-1 EPA List of Control Measures
Appendix 8-1 Example 2009 Mobile Emission Projection Calculations


