DELAWARE SOLID WASTE AUTHORITY
FINAL
ORDER AND DECISION
502 Statewide Solid Waste Management Plan
1. This is the Final Order and Decision of the Directors of the Delaware Solid Waste Authority (the "Authority") on proposed amendments, in the form of an addendum (the "Addendum"), to the Statewide Solid Waste Management Plan.
2. On June 1, 2013, the Authority caused to be published, in the Delaware Register of Regulations, notice of the Addendum. The proposed Addendum was also the subject of publication in the Delaware State News on June 10, 2013.
3. In accordance with 7 Del.C. §6403(j), on Tuesday, July 2, 2013 a hearing was held before Michael W. Teichman, Esquire, the Authority's designated hearing officer. At the hearing, documents and sworn testimony were received into evidence.
4. The Authority issues this Final Order and Decision after a review of the documents and evidence admitted into the record at the hearing, as well as a careful review of the hearing officer's Proposed Order and Recommendations dated July 17, 2013.
Summary of Evidence, Findings of Fact and Conclusions of Law
5. The summary of evidence set forth in the hearing officer's Proposed Order and Recommendations accurately summarizes the documentary evidence and verbal testimony received into the record.
6. The findings of fact and conclusions of law in the Proposed Order and Recommendations appear well reasoned and amply supported by the summary of the evidence contained therein.
7. Accordingly, the summary of the evidence, findings of fact and conclusions of law set forth in the Proposed Order and Recommendations are incorporated by reference and adopted herein in their entirety as if fully set forth herein.
Decision
8. For the reasons set forth above, the addendum to Statewide Solid Waste Management Plan Authority is hereby adopted in the form set forth in Exhibit A hereto.
SO ORDERED this 25th day of July, 2013
|
Richard V. Pryor, Chairman
|
Tonda L. Parks
|
|
Ronald G. McCabe, Vice Chair
|
Theodore W. Ryan
|
|
Gerard L. Esposito
|
Timothy P. Sheldon
|
|
Gregory Moore
|
|
502 Statewide Solid Waste Management Plan
Statutory Authority: 7 Delaware Code,
Section 6403 (7 Del.C. §6403)
Statewide Solid Waste Management Plan
For Delaware:
Moving Toward Zero Waste
INTRODUCTION
Purpose and History
Purpose
The enactment in 1975 of Title 7, Chapter 64 of the Delaware Code made the Delaware Solid Waste Authority (DSWA) responsible for developing, adopting and implementing the Statewide Waste Management Plan for Delaware. DSWA last adopted a Statewide Plan in May, 1994. An amendment to the 1994 Plan was adopted by the DSWA in March, 1999.
House Joint Resolution No. 5 was proposed during the 2009 Legislative Session requesting that the Department of Natural Resources and Environmental Control (DNREC) and DSWA “enter into discussions leading to a plan with enabling legislation to be delivered to the Legislature of the State of Delaware”.
DSWA agreed with DNREC that DSWA would develop a statewide solid waste management plan incorporating zero waste principles for review by DNREC and presentation to the General Assembly. This document represents DSWA’s ten-year plan, incorporating zero waste principles to provide the framework for actions taken by DSWA and other stakeholders in Delaware to maximize recycling and diversion of materials from landfill disposal.
History
Prior to the establishment of DSWA, a disjointed system of public and private collection and disposal existed throughout Delaware. Delaware had no significant public recycling programs and minimal private recycling companies.
Growth of population led to an increased quantity and complexity of solid waste generation, which made waste disposal problems acute in the densely populated areas. In less densely populated areas, the protection of the groundwater and wetlands were not a consideration in the disposal of solid waste.
The counties and municipalities turned to the State for solutions to their solid waste disposal problems. The State Legislature established The Delaware Solid Waste Authority (DSWA) on August 12, 1975, based on a recommendation from DNREC in a document entitled, “State Plan for Solid Waste Management”.
DSWA is a public instrumentality of the State of Delaware, directed by statute to establish various programs related to the management of solid waste in a manner which best serves the citizens of the State and enhances protection of the environment. The establishment and implementation of programs for the management of solid waste must be consistent with DSWA’s Statewide Solid Waste Management Plan (Plan).
i-ii
The Plan consists of the establishment of policies and goals, together with identification of programs necessary to implement the policies and goals, directed from a State level in order for DSWA to execute them. The Plan is intended to address the roles and responsibilities of DSWA in solid waste disposal and recycling diversion activities as they relate to public bodies (State, counties, municipalities) and private enterprise. This Plan is based on Zero Waste Principles. According to the Zero Waste Alliance:
“Zero Waste is a goal that is ethical, economical, efficient and visionary, to guide people in changing their lifestyles and practices to emulate sustainable natural cycles, where all discarded materials are deigned to become resources for others to use.
Zero Waste means designing and managing products and processes to systematically avoid and eliminate the volume and toxicity of waste and materials, conserve and recover all resources, and not burn or bury them.
Implementing Zero Waste will eliminate all discharges to land, water or air that are a threat to planetary, human, animal or plant health.”1
CHAPTER 1
Waste Generation and Demographics
Introduction
DSWA is ultimately responsible for managing the solid waste generated in Delaware. While DSWA has some capacity to slow the quantities delivered to its’ transfer stations and landfills through waste diversion programs, much of the demand for DSWA disposal capacity is driven by population and economic growth, as well as decisions by Delawareans to recover materials that would otherwise go to landfill.
DSWA began accepting waste for disposal in 1980. Since its inception, DSWA has been faced with significant growth in population and economic activity, and resulting growth in solid waste requiring disposal.
Figure 1-1 Delaware Population Growth and Projections, 1900 – 2030
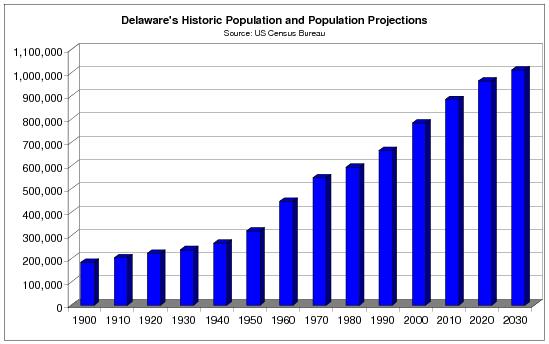
As illustrated by Figure 1-1 the population of Delaware has almost doubled between 1970 and 2008, and the growth rate has continued unabated since DSWA’s last solid waste management plan was released in 1994 (as amended in 1999). In fact, between 1990 and 2000 Delaware was the 13th fastest growing state in the United States.2
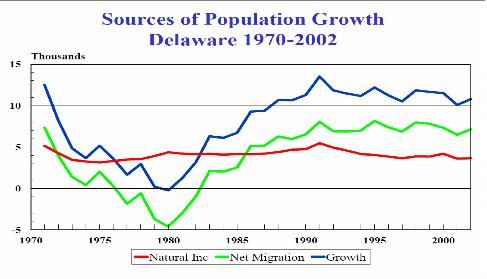
The majority of growth in Delaware has been due to net immigration, as illustrated by Figure 1-2, as opposed to natural increases (the red line in Figure 1-2) associated with births and deaths which have remained relatively flat over the past 30 years.
Figure 1-2 Sources of Population Growth in Delaware, 1970 - 2002
(Source: Center for Applied Demography and Survey Research, University of Delaware)
These high growth rates have significantly impacted DSWA’s facility planning. For example, DSWA’s 1994 Plan reported that residential tonnage had increased at an annual compounded rate of 5.7 percent per year between 1985 and 1990, and industrial and commercial waste had increased at a rate of approximately 11.5 percent per year.3
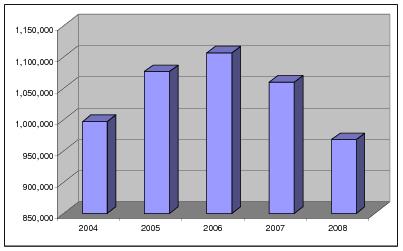
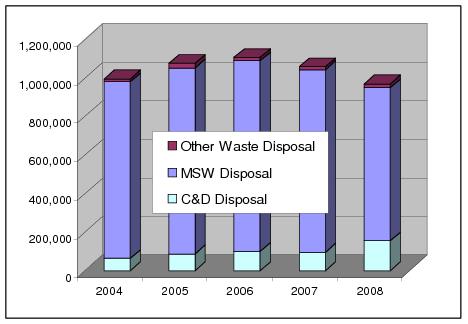
Annual growth in residential and commercial waste disposal at DSWA facilities continued through 2006, as illustrated by Figure 1-3, but has dropped significantly since 2006, primarily as a result of slowing economic activity associated with the current recession, but also as a result of new single stream curbside collection programs implemented by DSWA and the City of Wilmington.
Figure 1-3 Total Disposal at DSWA Facilities, Tons, 2004 – 2008
More importantly, population and economic growth in Delaware resulted in significant increases in construction of new housing and commercial buildings to accommodate the increased population. As illustrated by Figures 1-4 almost one-half of the increase in total tonnage managed by DSWA over the past 5 years has been the result of increasing construction and demolition (C&D) tonnage.4
It should be noted that the private Delaware Recycled Products, Inc. (DRPI) landfill located in New Castle County also received C&D from Delaware generators. Total tonnage delivered to DRPI for disposal last year was 253,000 tons (rounded); of which roughly one-half was generated in Delaware.5
Figure 1-4 MSW and C&D Disposal at DSWA Facilities, Tons, 2004 – 2008
Delaware’s growth not only resulted in ever increasing tonnages of material disposed of at DSWA facilities, but also has implications going forward. Specifically, the rapid increase in new housing developments (and associated economic activity) has significantly reduced the amount of available agricultural land in Delaware.
Delaware experienced a total loss of 142,712 agricultural acres in 33 years6; 55 percent of that loss from 1997 to 2007. The rapid growth of developed land and loss of agricultural land in Delaware can be largely attributed to the increase of residential and commercial / industrial land use. From 1974 to 1997, residential land use increased by 81,156 acres and commercial / industrial land use increased by 28,585 acres, for a combined increase in developed acreage of 109,740 acres. In that same time span, Delaware lost 137,671 acres of agriculture and forest land, or nearly 11% of total acreage.
1-4
Figure 1-5 shows the increase in residential and commercial / industrial land use by county in the 23 year span from 1974 -1997.
Figure 1-5 Change in Land Use from Agricultural to Other Uses, Acres
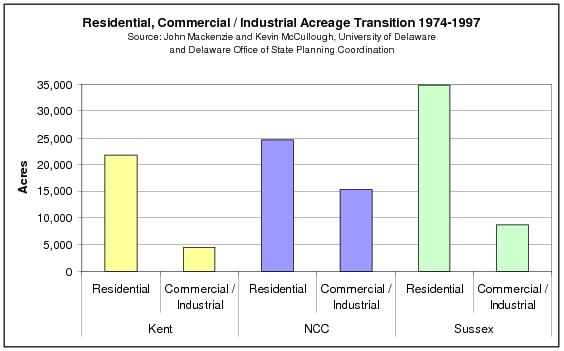
As illustrated by Figure 1-5, large losses of open lands have occurred in all three counties, with the most occurring in Sussex County. This is important because nutrient loadings to the Delaware and Chesapeake Bays are of significant concern. As a consequence, Delaware has implemented a nutrient management plan which limits the total amount of nutrients that may be applied to agricultural lands in Delaware. As the amount of land available for land application declines, the amount of poultry wastes and wastewater treatment plant (WWTP) sludge which can be land applied also declines. Unless alternative uses for these organic waste streams can be identified, increasing quantities of these waste streams may require landfilling.
Increased population and economic growth also limits the ability of DSWA to site new processing and disposal capacity going forward, significantly increasing the value of DSWA’s existing facilities.
Other implications of increased population growth and changes in land use in Delaware with respect to solid waste management going forward include the following:
Current Waste Generation and Recovery
This Statewide Solid Waste Management Plan encompasses all waste streams generated in Delaware, but concentrates on those waste streams currently managed at DSWA facilities.
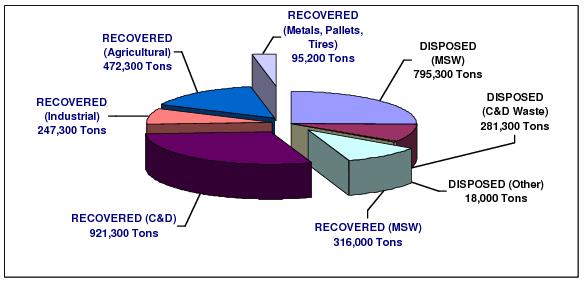
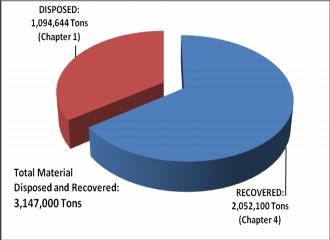
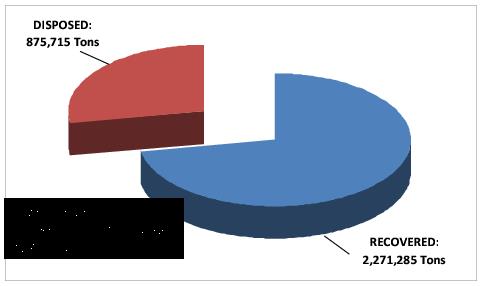
Figure 1-6 graphically represents current generation, recovery and disposal of all Delaware solid wastes.7 As illustrated by Figure 1-6, roughly 3.15 million tons (rounded) of solid wastes were estimated to be generated in 2008, with 2.05 million tons (rounded) estimated to be diverted for recovery and 1.1 million tons (rounded) disposed at DSWA landfills and the Delaware Recycled Products Incorporated landfill.
This represents a 65 percent diversion rate for all solid wastes and a 29 percent recycling rate for Municipal Solid Wastes (MSW).8 Achieving the high diversion rates required to meet zero waste principles will require diversion of significantly greater quantities of waste from landfill. Because most of what is still going to landfill is MSW, this is where the bulk of new recovery must come from (as discussed in Chapter 4).
Figure 1-6 Current Recovery and Disposal of All Solid Waste in Delaware (Annual Tons, CY 2008)
Population and Waste Generation Projections
According to the Center for Applied Demography & Survey Research at the University Of Delaware,9 Delaware will add roughly 42,000 new households between 2010 and 2020. Assuming an average of 2.6 persons per household, Delaware’s population will grow by roughly 109,200 over this ten year period.
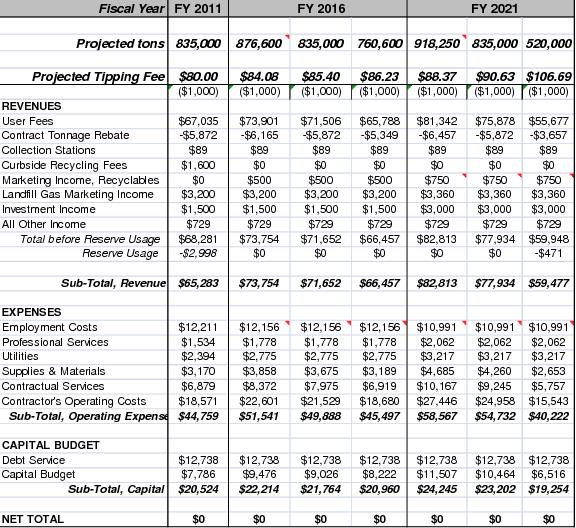
Typically, projections of future waste generation would assume growth in per capita waste generation associated with increased consumption of goods and services per person (and therefore more waste per person), as well as increases due to population growth. However, as Figure 1-3 (above) illustrates, waste disposal at DSWA facilities fell by 12.5 percent between 2006 and 2008, from 1.1 million tons to 968,000 tons. DSWA is projecting, for budgeting purposes, a further decline to roughly 835,000 tons for FY 2011. This makes projections looking forward difficult, with some waste management professionals arguing that per capita waste generation will increase to pre-recession levels as soon as the recession is over, and others arguing that structural changes in the economy and people’s behavior will result in declining per capita generation going forward.
A comparison might be made to energy use in the United States. According to the Energy Information Administration, greenhouse gas emissions associated with energy production in the United States has fallen 9 percent over the past two years,10 and are not expected to reach 2007 levels again until 2019. It is certainly possible that similar projections for waste generation are reasonable over the same time frame for Delaware.
More importantly, events not directly tied to population growth may have more impact on DSWA landfill capacity. These include:
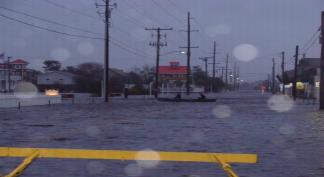
The results of these types of events can significantly increase demand for waste disposal capacity in Delaware, but are unpredictable in projecting future capacity requirements.
Given uncertainties in economic growth going forward, Figure 1-7 illustrates the impact of population growth alone on future MSW and C&D waste disposal quantities; under three scenarios for per capita waste generation – no change, a 20% increase and a 20% decrease.
As illustrated by Figure 1-7, if the per capita waste generation rates observed in 2008 (at the height of the recession) remain stable going forward, population growth and associated increased economic activity will not result in total MSW disposal reaching 2006 disposal levels again until the end of the 2020 Plan horizon. Conversely, even with a 20 percent reduction in per capita MSW and C&D waste generation, population growth eventually overwhelms these waste reduction gains. This illustrates the importance of both source reduction actions (to reduce per capita waste generation) and waste diversion activities (to divert greater quantities of waste from disposal).
Figure 1-7 also illustrates the difficulties of predicting landfill lifetimes in Delaware. In essence, the 2007 economic recession, and associated decline in waste disposal significantly increased DSWA’s estimate of landfill life. If per capita generation rates were to rebound to 2006 levels, and population and economic growth also rebounded, then estimates of future landfill lifetimes would have to be adjusted downward again.
Figure 1-7 Waste Disposal Projections Based on Population Growth and Changes in Per Capita Waste Generation, Tons, 2010 – 2030
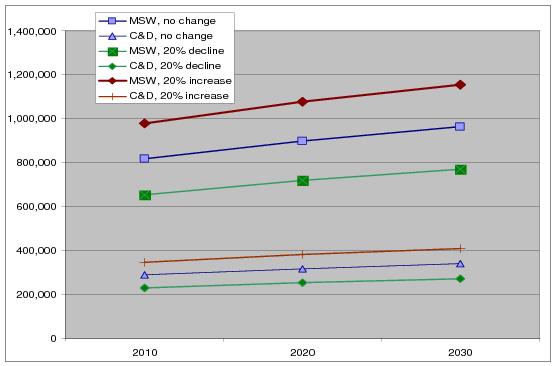
FIGURE 1-7 NOTES:
(1) MSW projections are made using CY 2008 per capita MSW disposal at DSWA facilities.
(2) C&D projections are made using per capita C&D disposal at both DSWA and DRPI facilities.
Waste Composition
Solid waste disposed at all DSWA facilities was characterized from a four season waste composition study carried out in 2006-07. Waste sorting occurred at all three DSWA landfills and at the three DSWA transfer stations. Separate samples were taken of residential and commercial waste for physical sorting and characterization. Construction and demolition waste and self-haul waste was visually characterized by a trained team using a tested protocol.
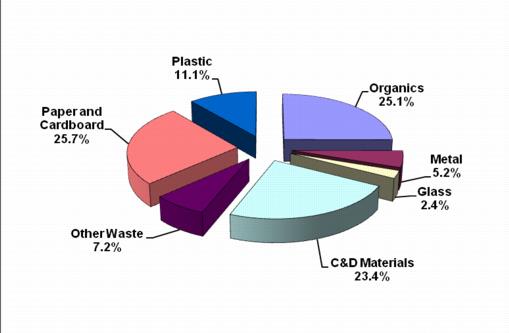
The results were used to determine both the composition of current waste disposed, and which material categories offer the most opportunity for increased diversion. Total waste composition is shown below in Figure 1-8.
Figure 1-8 Statewide Solid Waste Composition of All Waste Streams 2006-0712
CHAPTER 2
Solid Waste Management Infrastructure
The solid waste management (refuse, recyclables and organics) infrastructure in Delaware consists of collection, processing, transfer and disposal equipment and facilities, together with the administrative and management institutions necessary to support the infrastructure. While the transfer and disposal infrastructure is owned and operated primarily by DSWA, the collection infrastructure is owned and operated by the private sector, municipalities, and DSWA. Processing is primarily owned and operated by the private sector.
Administration and management is carried out by DNREC (regulatory authority), DSWA, municipal departments of public works, and the private sector.
A summary of the infrastructure is provided below. This summary is not intended to be a complete inventory, but rather to provide information relevant to the stated objectives of moving toward zero waste principles.
Collection
Residential Refuse
There are roughly 347,300 households in Delaware.13 Approximately 47,350 households receive curbside refuse collection from public works departments in the nine communities listed below, using approximately 77 licensed garbage trucks.
An estimated 20,000 households are in multi-family dwellings which receive collection by private haulers as part of commercial collection routes. An additional number (unknown, but expected to be under 5,000) of mobile home parks and planned communities provide their own collection service using another 18 licensed garbage trucks. In addition, an estimated 15,000 to 25,000 households bring their waste to one of the five DSWA collection centers, or to the self-haul areas at the transfer stations and landfills.14
The remaining 250,000 to 260,000 (estimated) households obtain subscription service through one of 42 private haulers for collection of refuse (Table 2-1). These haulers operate approximately 330 licensed garbage trucks to collect residential refuse.
Table 2-1 Estimates of Total Households Served by Refuse Collection Infrastructure in Delaware, 2009
Refuse Collection Type | Estimated Households Served (1) | % of Total Households (%) |
Subscription curbside | 254,650 | 73% |
Municipal curbside | 47,350 | 14% |
Multi-family (Commercial containerized) | 20,000 | 6% |
Use Drop-off Facility | 20,000 | 6% |
Mobile homes, condominiums, etc | 5,000 | 1% |
Total Households: | 347,000 | 100% |
TABLE 2-1 NOTE:
(1) All numbers are estimated based on best available information.
Residential Recycling
In November 2009, an estimated 76,000 Delaware households (rounded) had curbside recycling service. All other households can recycle at DSWA drop-off centers.
Almost all of the recycling collection service is provided as single stream collection and the majority of households receive a cart to use for collection.
This household curbside recycling collection count includes DSWA curbside recycling collection accounts, municipally contracted curbside collection, as well as the curbside recycling collection programs operated by the Cities of Wilmington, and Newark. It also includes estimates of households that subscribe directly with their refuse hauler for curbside recycling.
These 76,000 households represent roughly 22 percent of all Delaware households (including multi-family). Just as important as access to curbside recycling is how the curbside recycling is paid for by the household. Households who receive curbside collection as part of a bundled service where recycling does not cost extra are much more likely to participate in recycling than households who must pay extra for curbside collection of recyclables over and above their refuse collection cost. Table 2-2 presents the estimated breakdown between households who pay a discrete extra charge for curbside collection service (subscription), and those that receive curbside collection of recyclables paid for through taxes or through higher refuse collection charges, where recycling is received as a bundled service.
Table 2-2 Households Receiving Curbside Collection of Recyclables
| Households | % of Total |
Municipal curbside Service (1) | 51,000 | 15% |
Subscription curbside(2) | 25,000 | 7% |
Total, Curbside Recycling: | 76,000 | 22% |
|
| |
Total Households: | 347,000 | 100% |
TABLE 2-2 NOTES:
(1) Where the Municipality or County provides or has arranged (through a contract) for service. In some municipalities, the household must also sign-up.
(2) Where households must subscribe, or sign up for service, and pay a fee for service.
Residential Yard Waste Collection
Most of the municipalities that collect refuse also separately collect leaves and yard waste seasonally.15 Leaves are often collected in urban areas in the fall to avoid clogging storm drains, and yard waste is collected in the spring growing season and fall leaf raking season.
Private haulers and DSWA also offer separate leaf and yard waste collection services for residents and businesses. It is unknown how many households subscribe to private haulers for separate leaf and yard waste collection. As of October 2009 just fewer than 5000 households were signed up for collection by DSWA. Households can sign up for free but must pay DSWA $1 per bag collected. Residents can also drop-off their yard waste at all DSWA landfills and transfer stations for a fee, and at three DNREC operated yard waste drop-off sites in New Castle County.
Finally many landscaping companies haul leaf and yard waste off-site for processing at their own facilities or at private processing centers (see below). In addition, material can be dropped off at private grinding and mulching operations located throughout the State with many locations charging a fee.
Commercial Refuse and Recycling Collection
There are an estimated 61,700 businesses16 located in Delaware. Most of them contract with a licensed waste hauler for refuse collection, and many contract for separate collection of recyclables – especially old corrugated containers and office paper. About 90 waste hauling companies operate 300 roll-off trucks and 150 front-end loading trucks to service these commercial refuse and recycling accounts.17
There are also many businesses and other organizations who haul their own waste to DSWA transfer stations and landfills.
Special Wastes
There are many businesses operating in Delaware that collect specific waste streams for recycling or special processing. Depending on the type of material, and the quantity, the materials may be picked up at the generator’s location, usually for a fee. In other cases, the material must be brought to a recycling facility where it is consolidated with other materials to be sent off for processing.
Table 2-3 below illustrates the types of materials separately collected and managed in Delaware, and lists whether collection is available from DSWA, the private sector or both parties. Where the DSWA column is checked, the material may be brought to a DSWA facility.
Table 2-3 Special Wastes Collected in Delaware and Collection Entity
Material | DSWA | Private Sector |
Asphalt | X | |
Carpet | X | |
Clean Wood | X | X |
Concrete | X | |
Electronics / Electronic Goods | X | X |
Fats, Oil, Grease | X | |
Fluorescent Bulbs | X | X |
Household Hazardous Waste | X | X |
Land Clearing (e.g. trees, stumps), mulched | X | |
Lead Acid Batteries | X | X |
Mixed C&D | X | X |
Oil Filters | X | X |
Other Metals | X | X |
Pallets | X | X |
Soils and Stone | X | |
Solvents (Used) | X | |
Textiles | X | X |
Tires | X | X |
Used Goods | X | |
Waste Oil | X | X |
White Goods | X | X |
Materials Processing
Delaware has a robust private sector recycling and organics brokering and processing system consisting of more than 70 companies/facilities recovering roughly 2 million tons of residential, commercial, C&D, and industrial waste materials annually. The types of materials handled by processing and brokering facilities operating in Delaware and the estimated number of businesses are outlined in Table 2-4.
Table 2-4 Materials Recycling and Organics Processors and Brokers Located in Delaware
Processors and Brokers | Estimated Number of Delaware Based Companies |
Agricultural Processing Wastes | 2 |
Asphalt, Brick & Concrete (ABC) | 4 |
Construction and Demolition Materials (1) | 12 |
Batteries | 2 |
Carpet | 1 |
Fats, Oil and Grease | 2 |
Oil | 1 |
Pallets | 9 |
Paper | 10 |
Plastics | 2 |
Tires | 2 |
Scrap Metal | 15 |
Yard waste, mulch and clean wood | 10 |
Subtotal: | 72 |
TABLE 2-4 NOTE: | |
(1) Includes processing of ABC waste and land clearing debris. | |
There are no single stream processing facilities in Delaware for mixed residential and commercial recyclables. However the DSWA operates two transfer stations for transfer of single stream materials to large single stream processors in adjacent Maryland, Pennsylvania and New Jersey. Transfer to large single stream processing facilities is increasingly common given the economies of scale associated with new, relatively capital intensive single stream processing equipment, with the largest single stream processing facility in the United States located just outside of Baltimore, Maryland.
The number of facilities processing yard waste has also increased since the ban on yard waste disposal at the Cherry Island landfill. DNREC now operates three yard waste composting facilities to provide additional drop-off locations and capacity to comply with the disposal ban, and many of the construction and demolition debris processing facilities listed in Table 2-4, above, accept yard waste for grinding and mulching.
DSWA Facilities and Programs
For many waste streams where there is not currently sufficient private sector involvement, DSWA has taken the lead in providing management programs to ensure the environmentally sound management of these special waste streams, particularly for those generated by the residential sector. However it is recognized that there is an unknown amount of private sector involvement for many of these waste streams, especially for wastes generated by the commercial sector.
In addition to the DSWA curbside and drop-off collection programs discussed above, DSWA provides the following programs:
Waste Oil and Waste Oil Filters
DSWA operates the first oil filter collection program in the United States. The program began collecting waste oil in 1990 and waste oil filters in 1993. DSWA collects waste oil filters from over 400 repair shops and service stations for a fee. DSWA also allows Delaware residents to take their waste oil and waste oil filters to 44 drop centers located throughout Delaware. The waste oil is currently collected and recycled by FCC Environmental of Wilmington. The waste oil filters are currently collected by DSWA staff, delivered to FCC Environmental and then sent to steel mills for recycling.
Household Hazardous Wastes
DSWA operates six or more HHW collection days throughout the State each year. Over 88 tons of HHW were collected in 2009 from over 2,800 Delaware residents. DSWA is evaluating the potential to add permanent collection centers for HHW at certain of its facilities to augment the collection days.
Electronic Goods Recycling
DSWA allows residents to drop off unwanted electronics for free at permanent collection locations. DSWA also allows businesses to drop off at two different locations for a fee. DSWA collected over 4 million pounds of electronic goods items for recycling in 2009.
Yard Wastes
DSWA composts yard waste delivered to the Cherry Island and Jones Crossroads landfills. Gore Technology is used tm to produce quality compost over a period of approximately eight weeks, compared to a minimum of six months with conventional windrow technology.
Used Textiles
DSWA provides drop off containers for used clothing and textiles at 39 of the 180 recycling drop off centers throughout Delaware. DSWA staff collects the materials and delivers the textiles to Goodwill Industries for reuse or recycling.
Institutional Structure
As discussed in the introduction to this Plan, the Act establishing the DSWA made DSWA responsible for developing, adopting and implementing a Statewide Solid Waste Management Plan. The Act also stated:
“That the Authority established pursuant to this chapter shall have responsibility for implementing solid waste disposal and resources recovery systems and facilities and solid waste management services where necessary (emphasis added) and desirable throughout the State in accordance with a state solid waste management plan and applicable statutes and regulations”.
In general, responsibilities for solid waste management in Delaware in 2009 can be categorized as follows:
Funding
Funding of the solid waste management activities summarized above comes from three sources:
CHAPTER 3
Source Reduction
Introduction
According to the United States Environmental Protection Agency (EPA), Source Reduction “refers to any change in the design, manufacture, purchase or use of materials or products (including packaging) to reduce their amount or toxicity before they become municipal solid waste. Source reduction also refers to the reuse of products or materials.” Because source reduction reduces the quantity of waste generated, it also reduces the need to manage that waste, either by recycling or disposal.
For example, Delaware’s total waste stream includes both material disposed and material diverted for recycling or beneficial reuse. Source reduction focuses on reducing both materials destined for disposal and materials diverted from disposal for recycling or beneficial reuse. In other words, source reduction shrinks the total material requiring management.
Figure 3-1 illustrates how a decrease of 20% in both material disposed and material diverted for recycling would reduce total material managed (source reduction) by roughly 630,000 tons saving disposal and diversion costs.
Figure 3-1 Impact of 20% Source Reduction on Total Material Disposed and Diverted
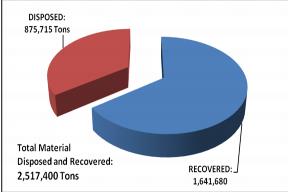
Alternatively, if waste generation remained equal (Figure 3-2), but an additional 20 percent of the material was diverted to recycling, the total amount of material managed (3.1 million tons) would be the same, with savings only in avoided disposal costs. For this reason, source reduction is always ranked first in the hierarchy of waste management.
Figure 3-2 Impact of 20% Diversion on Total Material Disposed and Diverted
Source reduction (also referred to as waste reduction) is a key component of Delaware’s Climate Change Action Plan18 and was recently recognized by the US EPA as providing a much greater opportunity for greenhouse gas emission reductions than originally calculated.19
Source reduction is also a critical component in moving the State of Delaware closer to zero waste goals. However source reduction gains are often outpaced by population and economic growth (see Chapter 1). In contrast, economic retraction can have a large impact on reducing waste generation as households and businesses consume less. Delaware, together with most other states, has, for the first time in decades experienced major declines in the quantity of both municipal solid waste and C&D waste tipped at all their facilities over the last eighteen months.
In spite of these declines, economic growth continues to be the overarching economic policy objective followed in the United States and in most other nations.20 In addition, as outlined in Chapter 1, population growth is expected to continue in Delaware over the next decade.
Many of the most effective methods to reduce waste generation fall outside of the DSWA’s current authorities. Understanding this constraint, this Plan puts forth strategies that might be undertaken by the Legislature, through regulation, or through DSWA (if certain legislative changes are made), designed to reduce waste generation and toxicity.
Table 3-1 outlines the most effective methods for consideration over the Planning horizon (to 2020), what entity has the primary enabling responsibility (action) and what entity would most likely implement each activity (Implementation).
Table 3-1Source Reduction Strategy and Responsibilities
Method | Action | Implementation |
Yard Waste Disposal Ban | Regulation | DSWA, DNREC, Haulers and Landscaping Companies |
Backyard Composting and Grasscycling Education | Funding | DSWA, DNREC, and Non-Governmental Organizations (NGO's) |
Education at Schools | Funding | DSWA, State Agencies, Contractors, and NGOs |
Commercial Waste Reduction | Legislation | DSWA, Business, Haulers and NGOs |
Pay-As-You-Throw | Legislation | Haulers |
Extended Producer Responsibility For Special Wastes | Legislation | Determined by Legislation |
Extended Producer Responsibility For Packaging | Legislation | Determined by Legislation |
Yard Waste Disposal Ban Expansion 21
An estimated 67,000 (rounded) tons of leaf and yard waste, and trees and branches were estimated to be landfilled in 2008. Landfill bans provide an opportunity to encourage source reduction of this material as well as to divert this material to other uses, provided grinding and composting operations are available.
Effective January 24, 2008 yard waste was banned from disposal at the Cherry Island landfill. As result, yard waste diversion increased dramatically in New Castle County with new grinding and mulching operations increasing capacity. Just as importantly, although harder to measure, source reduction of yard waste also occur as more households and landscapers practice grasscycling, use mulching mowers and manage leaf and yard waste on-site.
Expanding the yard waste ban to the other two DSWA landfills will be an effective measure to maximize both source reduction and diversion of yard waste from disposal.
Backyard Composting and Grasscycling Education
Backyard composting of leaf and yard waste and food waste is an effective way for households to reduce waste generation, create nutrient rich compost for use in vegetable and flower gardens, and comply with a yard waste disposal ban. Many simple enclosed composters are now available for household use. Education on the value of backyard composting and training on how to manage composters and compost piles is an important part of increasing the number of households that participate in backyard composting.
Encouraging the practice of grasscycling -- leaving grass clippings on the lawn when mowing – is also a critical component of source reduction. Once cut, grass clippings dehydrate then decompose, which not only return nutrients to the lawn but save money on disposal.
Education at Schools
Education targeted at youth provides one of the best chances that waste reduction becomes integral to future generations in Delaware. Conducting presentations and assemblies at area schools, inviting class trips to waste management and recycling facilities, and performing waste audits at the schools themselves all provide the direct opportunity to emphasize waste reduction with Delaware’s youth.
Commercial Waste Reduction Initiatives
Commercial waste generators need to be targeted, either individually or by sector, to promote waste reduction. Waste audits and hauling contract modifications can be two effective methods to impact waste generation in businesses.
While businesses are inherently efficient, and many waste streams equate to wasteful business practices, some sectors and individual businesses need assistance in identifying opportunities for waste reduction. Waste audits by trained professionals are costly but often provide the best opportunity to target certain waste streams and practices that impact waste generation.
Pay-As-You-Throw (PAYT) Pricing
Pay as you throw (PAYT) programs have been implemented in over 7,000 communities across the United States. PAYT programs price refuse collection services to encourage diversion or reduction of waste by setting prices based on the volume or weight of refuse collected for disposal. Typically, households pay by the size and number of containers or bags of refuse they set out for collection.
Charging by volume or weight of refuse set out for collection provides an economic incentive to the generator (e.g. household) to divert material to recycling, organics composting or other uses, especially when coupled with curbside recycling and yard waste collection programs where the cost is included in the refuse collection charge.
Extensive research on the impact of PAYT has been conducted by Skumatz Economic Research Associates (SERA). SERA’s research indicates that PAYT programs reduce residential disposal by a total of 16 – 17% at the landfill and attributes this reduction to three factors (source reduction, recycling and yard waste diversion). SERA estimated that 5-6% of that decrease was attributable to recycling effects and 4-5% was attributable to yard waste diversion leaving the balance of 5-7% to source reduction (Skumatz, May 2000).
Because all of these actions combined are critical to move the State toward a zero waste goal, PAYT must be considered to achieve the stated zero waste goals.
Extended Producer Responsibility for Special Wastes
Extended Producer Responsibility (EPR) is an environmental policy approach under which the responsibility of industry for their products and packaging is extended to include management of the product or packaging at the end of its lifetime.
Extending the responsibility for special wastes (e.g., electronics, paint, fluorescent bulbs, mercury containing devices, carpet pharmaceuticals, etc.) is not a new concept and has been used successfully in a number of states to manage hard-to-handle materials.
EPR can create a framework for better overall management of hazardous and hard to handle wastes, where some components of these special wastes can be recovered through processing and others disposed safely. In addition, EPR requires that manufacturers better understand that the end of life costs are an important part of product manufacturing. Because the product (or packaging) producer bears the waste management cost there is more of an economic incentive for the producer to reduce the quantity or toxicity of the product and package. This can result in better product design and material substitution to reduce the need for special handling.
Recent leachate data from Maine indicates that landfill leachate may contain trace amounts of pharmaceuticals. Treatment of the leachate at waste water treatment plants does not eliminate these pharmaceuticals, meaning that they eventually are discharged to surface water. Because of the presence of controlled substances in pharmaceutical waste, special or permanent collection events are legally difficult to run. Therefore an EPR for unwanted pharmaceuticals requiring pharmaceutical take-backs may the best option for this waste stream.
Extended Producer Responsibility for Packaging
Delaware already has a partial EPR for carbonated beverage packaging (glass and PET), and for retail plastic bags.22 However carbonated beverage containers and retail plastic bags represent a relatively small fraction of total packaging disposed at Delaware landfills.
While EPR programs for other types of packaging do not currently exist in the United States, many countries outside of the US have moved well beyond beverage container deposits in an attempt to significantly increase recycling of all packaging. Beginning with the German Packaging Ordinance in 1991, making packaging producers and distributors responsible for taking back and recycling their packaging, 30 countries now have some form of EPR for packaging. This includes: all 15 of the original western European Union countries; a number of central European countries; Taiwan, Korea and Japan; and, the majority of provinces in Canada.
EPR has been imposed on packaging producers and distributors in several ways from requirements to physically take back or recycle the packaging, to simply charging an advanced disposal fee to packaging producers to fund existing and new recycling programs. With declining tonnage at DSWA landfills making it extremely difficult to increase tipping fees to fund recycling, an EPR program to fund increased recycling would provide a potential alternative funding source that also worked to reduce the amount of packaging requiring disposal.
CHAPTER 4
Materials Recovery
Achievement of high recovery rates for all recyclable and compostable materials for which current diversion programs are in place is critical to achieving zero waste goals. However, it will also be necessary to add as many materials to the list of recoverable materials as possible assuming potential markets for these materials exist or can be created. This will necessitate expanding both DSWA’s management activities and the municipal and private sector collection and processing infrastructure.
Chapter 2 provides an overview of the current collection and processing infrastructure in Delaware. This Chapter provides baseline materials recovery estimates, and describes changes necessary to increase materials recovery.
Similar to waste reduction actions, many of these actions are beyond the authority of DSWA and will require action by the Legislature, investment in infrastructure by the private sector and DSWA, and the regulatory mandates to support these investments.
Baseline Recycling and Diversion Rates
The Recycling Public Advisory Council (RPAC) reports the MSW recycling rate on an annual basis. The RPAC report is based on voluntary reporting of recycling from hundreds of generators, brokers and recyclables processors in Delaware.23
Excluded from the MSW recycling rate, however, are C&D materials as well as other waste streams generated in Delaware but not managed at DSWA facilities. These materials are discussed in Chapter 1 Current Waste Generation and Recovery and depicted in Figure 1-6. If only MSW materials are accounted for, a recycling rate of 29% is measured for CY 2008.24 If beneficial reuse of all waste streams is included, the diversion rate (recycling plus beneficial reuse) is estimated to be 65% as shown in Table 4-1.
Table 4-1 Estimated Recycling and Diversion Rates for Municipal Solid Waste (MSW) Only and For All Waste Streams, CY 2008
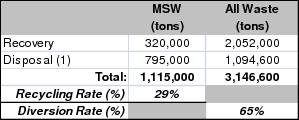
TABLE 4-1 NOTES:
(1) DSWA MSW Disposal from Appendix Table A-4, rounded.
Appendix Table A-1 provides a detailed breakdown of all materials included in the all waste diversion estimate of 2,052,000 tons used in Figure 4-1. The Eighth Annual Report of the RPAC (November 2009) provides a breakdown of all materials included in MSW recycling rate estimate for CY 2008, and was incorporated in the estimates used for this Plan and shown in Table A-1.
Baseline Materials Recovery Rates
While recycling rates are often used to judge the success of waste diversion programs, material recovery rates are critical to determining how much more material could potentially be diverted. Delaware is fortunate in that it has one of the best data collection programs for waste disposal and recycling in the United States. As a result, relatively accurate material recovery rates can be estimated and used to project potential future recovery rates.
Current recovery rates by material type have been estimated for this Plan based on the most recent annual recycling report completed by RPAC (CY 2008), based on strict EPA definitions of recycling, and the DSWA Statewide Waste Characterization Study (2006-07). Disposal tonnages by material were adjusted from the Waste Characterization Study based on current disposal rates (CY 2008) to estimate current disposal and calculate recovery rates for the most recent year data are available.
Recovery rates for the most common recyclables included in calculating the MSW recycling rate are estimated for CY 2008 in Tables 4-2 and 4-3 for the residential and commercial sectors respectively. In addition, materials with very low recovery rates (e.g. food waste and compostable paper) are included in Tables 4-2 and 4-3 to show opportunities for recovery for these high volume materials and to illustrate where diversion is necessary to reach zero waste goals.
Table 4-2 Estimated Current Recovery Rates, by Material Type, for Residential Recycling In Delaware (CY 2008)
Recycled (1) | Landfilled (2) | Recovery Rate | |
Material | (tons) | (tons) | (%) |
Newspaper | 7,200 | 25,200 | 22% |
Cardboard | 2,300 | 19,900 | 10% |
Mixed Paper / Junk Mail / Boxboard | 12,800 | 35,000 | 27% |
Subtotal, Paper (3)(4): | 22,300 | 80,100 | 22% |
Mixed Glass | 11,400 | 12,000 | 49% |
Plastic Bottles - HDPE #2 | 600 | 4,100 | 13% |
Plastic Bottles - PET #1 | 700 | 5,300 | 12% |
Aluminum and Steel Cans | 800 | 6,400 | 11% |
Subtotal, Other Packaging (3)(4): | 13,500 | 27,800 | 33% |
Leaf and Yard Waste | 60,000 | 53,400 | 53% |
Food Waste | 0 | 44,400 | 0% |
Subtotal, Organics: | 60,000 | 97,800 | 38% |
TABLE 4-2 NOTES: | |||
(1) The Eighth Annual Report of the Recycling Public Advisory Council, November 2009, Authored by: The Recycling Public Advisory Council. | |||
(2) Delaware Solid Waste Authority Statewide Waste Characterization Study, 2006-2007, Prepared by: Cascadia Consulting Group, DSM Environmental, MSW Consultants. Adjusted for 2008 residential tonnage, and rounded. | |||
(3) Includes 33,300 tons of single stream recyclables (net of contamination) and the balance is glass and mixed paper. | |||
(3) Composition of single stream recycling was estimated based on sorting results in Knoxville, TN (March, 2009). (4) Numbers may not add due to rounding. | |||
Table 4-3 Estimated Current Recovery Rates, by Material Type, for Commercial Recycling In Delaware (CY 2008)
Recycled (1) | Landfilled (2) | Recovery Rate | |
Material | (tons) | (tons) | (%) |
Newspaper | 4,000 | 9,600 | 29% |
Cardboard | 74,200 | 64,500 | 53% |
Mixed Paper | 17,500 | 30,600 | 36% |
Subtotal, Paper (3): | 95,700 | 104,700 | 48% |
Mixed Glass (3) | 10 | 6,300 | 0.2% |
Plastic Bottles (3) | 30 | 6,700 | 0.4% |
Aluminum and Steel Cans (3) | 2,060 | 9,200 | 18% |
Pallets (4) (5) | 20,900 | 27,500 | 43% |
Shrink Wrap/Recoverable Film | 2,000 | 9,600 | 17% |
Subtotal, Other Packaging (3): | 25,000 | 59,300 | 30% |
Leaf and Yard Waste | 7,200 | 8,400 | 46% |
Food Waste | 5,700 | 57,000 | 9% |
Compostable Paper | 0 | 33,900 | 0% |
Subtotal, Organics: | 12,900 | 99,300 | 11% |
TABLE 4-3 NOTES: | |||
(1) State of Delaware Assessment of Municipal Solid Waste Recycling For Calendar Year 2007, Prepared by: DSM Environmental | |||
(2) Delaware Solid Waste Authority Statewide Waste Characterization Study, 2006-2007, Prepared by: Cascadia Consulting Group, DSM Environmental, MSW Consultants. Adjusted for 2008 residential tonnage, and rounded. | |||
(3) Includes 4387 tons of single stream recyclables, which is assumed to be mostly cardboard and mixed paper (with some glass, newspaper, plastic bottles and aluminum cans) and accounted for in these material categories. | |||
(4) Includes pallets recovered for remanufacturing so not classified as MSW recovery | |||
(5) Includes pallets disposed with C&D waste in commercial disposal. | |||
(6) Numbers may not add due to rounding. | |||
As shown in Tables 4-2 and 4-3 there is significant opportunity to increase recovery in both the residential and commercial sectors. This Chapter lays out an aggressive action plan to increase recovery of these materials. However, even the achievement of very high recovery rates for the materials listed in Tables 4-2 and 4-3 will not be sufficient to achieve the types of diversion rates envisioned by zero waste goals. Therefore, efforts will also be necessary to significantly increase recycling of C&D wastes and other commercial, institutional and industrial wastes.
A comprehensive assessment of all of these waste streams was performed in 200625. The results from this assessment are incorporated in Appendix Table A-1, A-2 and A-3 to this Plan, and provide a detailed profile of all waste generated and recovered in Delaware.
Recovery estimates are coupled with disposal estimates in Appendix Table A-2 to derive current recovery rates for all materials (not only those that would be categorized as MSW) required to meet zero waste principles.
As illustrated by Appendix Table A-1 and A-2, C&D materials have high current recovery rates, and are a major contributor to the overall waste recycling rate. However, as illustrated in Figure 1-8, C&D materials still represent roughly 23 percent (rounded) of total waste disposed in Delaware, providing the potential opportunity to divert even greater amounts of C&D materials going forward.
Diversion goals are presented in Chapter 7. The systems needed to achieve these high diversion, or recovery, rates are described below.
Residential Recycling
Recycling Collection
As outlined in Chapter 2, roughly 22 percent of Delaware households have voluntary curbside recycling while over 90 percent of households have curbside (or containerized) refuse collection. Households without curbside recycling have access to 180 DSWA drop-off centers for recycling.
Delaware has one of the most extensive drop-off recycling programs in the United States. However, despite 180 drop-offs, and careful placement, participation in drop-off recycling is still limited to an estimated 16 percent of households. 26 This low participation rate is most likely because almost all of these households have curbside collection of refuse, requiring separate handling of recyclables and special trips to recycle at drop-off facilities.27
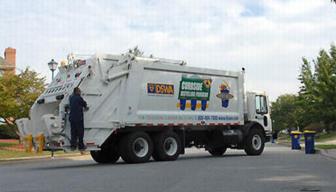
To increase recycling, DSWA began to offer subscription curbside recycling collection in 2005, first in New Castle County and later statewide. Households subscribe for service, just as they do for curbside refuse from private haulers, and pay a monthly fee, currently set at $6 per month.28 Subscription rates have grown substantially since the offer began with roughly 12 percent of Delaware households now provided with this service, some through their municipality.29 The collection service offered is single stream with each household provided with a 65 gallon cart which is collected every other week.
The largest barriers to further increases in household participation in recycling are cost and convenience. Roughly 7 percent of Delaware households are assumed to pay directly for curbside collection (see Table 2-2). The highest participation rates found in curbside recycling programs are where households are offered both refuse and recycling service on the same day, with limited special set-out requirements (i.e. single stream, one cart). This parallel system (e.g. refuse and recycling service are provided by the same collection method, either both at the curb, or both at a drop-off facility) is the most convenient and enables most households to participate.
Universal Curbside Recycling
The most efficient way to greatly expand participation in residential recycling is to move to universal recycling, where all municipal and private residential refuse collection haulers provide curbside recycling along with refuse collection service, and include both services in a single refuse collection price. This will require legislation mandating that all residential refuse haulers operating in Delaware provide curbside recycling as part of a bundled refuse collection service.30 This universal recycling requirement will have a significant impact on increasing residential recycling.
However, over time it may also be necessary to impose mandatory PAYT pricing, as discussed in Chapter 3, to attain the very high diversion rates anticipated under zero waste diversion goals.
DSWA’s role in the system will be to assure that locations are available at designated DSWA solid waste management facilities to receive the collected recyclables, and to assure that the materials are processed, either through development of a processing facility in Delaware, or through transfer to existing processing facilities adjacent to Delaware. However, DSWA will not require that recyclables be delivered to a DSWA facility, allowing private haulers to use other recycling processing or transfer facilities if they so choose. This will mean that it will be necessary to mandate that all private haulers report on an annual basis quantities of recyclables collected to assure that RPAC can continue to compile accurate recycling rate calculations to measure progress toward meeting the recycling rate goals established in this Plan.
Drop-off Recycling
Drop-offs recycling centers will need to be continued by DSWA, but the number of drop-off centers can be significantly reduced once universal curbside recycling has been implemented. Drop-off centers at DSWA facilities and in high traffic areas will still be necessary to serve households who do not receive curbside refuse collection, and to provide all households with access to recycling of special wastes not collected curbside, such as clean textiles and waste oil and filters
Residential Leaf and Yard Waste Collection
Like parallel recycling, parallel leaf and yard waste collection will be necessary in densely population areas where on-site recycling of yard waste and landscaping debris is not possible. As discussed in Chapter 3, backyard composting and grasscycling is the best approach to managing yard waste and cut grass. However in areas where yard waste generation is inevitable, collection is necessary and should be offered through the leaf and growing season on an as needed basis separate from refuse collection so that it can be delivered to yard waste composting or mulching facilities.
Commercial Recycling
Until recently, most commercial recycling in Delaware was done for economic purposes. For example, corrugated cardboard generated in large quantities by large grocers and retailers was baled on site and backhauled to central distribution facilities for sale to brokers, or directly to paper and pulp mills. Overstock printing paper, trim and overprints were also consolidated for transport to paper brokers and end markets, and paper shredding and recycling operations, designed to provide confidential document destruction, have also increased their market share.
Additional commercial recycling has been performed to comply with environmental regulations, including recovery of lead acid batteries, oil filters, electronics and other hazardous materials. More recently, recycling of some materials has occurred as a result of corporate sustainability goals.
However, in spite of these developments, there is still much opportunity to increase recovery of materials from the commercial waste stream. Based on the recovery rate estimates in Table 4-3, all types of paper can be recovered at higher levels and commercial container recycling needs widespread expansion.
Programs that are potentially necessary to achieve zero waste goals for commercial waste generation include:
Food Waste and Other Organics Composting
As shown in Tables 4-2 and 4-3, there is significant opportunity to divert large quantities of food waste and other organics material from disposal. Much of this material is generated in New Castle County where a new composting facility began accepting material in December 2009 (See Case Study on Wilmington organics Recycling Center). Organic waste generated in Kent and Sussex Counties can also be delivered to the existing Blessing and Blue Hen facilities in Sussex County.
Diverting commercial food waste and other compostable materials (other than yard wastes) to these facility will require changes to the way that commercial food waste generators manage their waste to increase the economic incentive to separate food waste from other waste. This might be accomplished through waste audits that assist generators in setting up on-site procedures to separate and store food waste and to restructure hauling contacts that minimize added collection costs and allow any disposal savings to be realized.
Residential food waste separation beyond backyard composting is more challenging, and can be viewed as a potential way to boost recovery after programs to divert commercial food waste are implemented. Adding a third collection stream to residential collection may be possible in densely populated areas, particularly if the collection can be organized to allow for weekly food waste and every other week residuals and other recyclables.
Construction and Demolition Debris Diversion
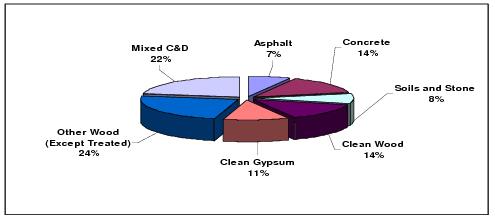
The final key to reaching zero waste diversion goals will be to increase the recovery of C&D materials. While DSWA currently grinds and recovers most C&D material delivered separately to the three landfills, roughly 23 percent of total MSW disposal in Delaware (including waste delivered to the DRPI landfill) is C&D material. As illustrated by Figure 4-1, clean gypsum and clean wood represent 25 percent of the remaining C&D landfilled in Delaware. There are markets for both of these materials assuming they can be source separated.
Figure 4-1 Composition of Construction and Demolition Waste Disposed in Delaware
The key to increasing C&D diversion will be to encourage additional separation of mixed C&D for grinding at all three DSWA landfills for use as alternative daily cover. This will require more accurate reporting by roll-off drivers of the material type (especially at the Cherry Island landfill). Delaware should also encourage development of a C&D processing facility near Wilmington to process C&D materials now going to both the DRPI landfill and the Cherry Island landfill. Finally, DNREC should consider a regulatory ban on the disposal of clean gypsum at Delaware landfills. Bans on gypsum disposal are being considered in many eastern states as a way to reduce hydrogen sulfide gas emissions from landfills. Such a ban would require housing contractors to separate gypsum from other C&D materials, and would require DSWA to develop markets for the separated, clean gypsum. There are a number of potential markets, including use as a soil conditioner, as an additive, and as an input to new gypsum wallboard construction.
Case Study:
Wilmington Organics Recycling Center
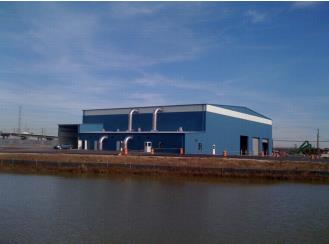
In December 2009 Peninsula Recycling opened the Wilmington Organics Recycling Center (WORC) at 612 Christiana Avenue next to the Port of Wilmington as the first commercial food waste compositing facility operating in Delaware. The facility expects to process 160,000 tons per year of organic wastes generated in the region, and is an important piece of infrastructure to help the State of Delaware move toward zero waste.
The facility couples the Company’s experience with Bedminster Bioconversion facility technology with the proven Gore Cover System Technology (A Delaware based Company). Facility management came from Nantucket, Massachusetts, where municipal solid waste (MSW) and biosolids composting is performed using the Bedminster technology and where the final product is screened, and a small amount of residue is being landfilled. WORC is not a MSW composting facility; instead, feedstock is limited to food waste, yard waste, and wood. This feedstock is expected to produce a higher quality product.
The Gore Technology is an encapsulated system that is “in vessel” approved and designed to eliminate odors and re-circulate leachate. The facility equipment includes a blower unit to aerate the piles of each windrow as well as a sprayer to control moisture levels. All wastewater at the site is collected and pumped directly to the City of Wilmington’s wastewater treatment facility for handling and treatment. This system is designed to accept cleaner organic material, and cannot handle high levels of contamination.
Feedstock is expected to come from food processors as well as institutions, grocers and restaurants from Delaware and surrounding states, that all generate large quantities of food waste. The facility can handle 120,000 tons per year of food waste. Cardboard and other compostable paper can be mixed with food waste loads and is a necessary component of the feedstock. Finally leaf and yard waste, and wood are sought to ensure a balanced carbon and nitrogen ratio.
The final product is expected to be sold to commercial landscapers and other end users for use as a soil amendment and/or nutrient rich compost. The first three weeks of operation (December 2009), the facility processed 2000 tons of material.
CHAPTER 5
Alternative Technologies
Introduction
Assuming that Delaware were able to achieve the very aggressive goal of diverting 82 percent of all waste by 2020, there would still be a need to dispose of over one-half a million tons of waste annually in DSWA landfills.
Given the difficulty in siting any new landfill capacity in Delaware, the limited lifetime of existing landfills, and the demand for renewable energy sources, it is logical that the State of Delaware must continue to investigate alternative technologies for processing wastes to reduce the volume going to landfill, and capture the energy inherent in the waste.
In addition, it is likely that to achieve high diversion rates, alternative technologies such as in-vessel composting and anaerobic digestion will be necessary to process organic wastes.
On October 18, 2005 Governor Minner issued a directive to the DNREC Secretary to convene a Working Group of technical experts to evaluate the suitability of alternative technological systems for processing Delaware’s municipal solid waste. The Working Group issued their Solid Waste Management Alternatives for Delaware report on May 15, 2006. DSWA participated in the Working Group and concurs with the two pronged recommendations contained in the Report.31.
According to the Working Group, “the first, and most important, prong is to divert as much valuable material from being disposed in the state’s landfills as possible…requiring that Delaware adopt aggressive and effective source reduction and materials recovery programs...that yard wastes be banned from all three of the state’s landfills” and “(that) DSWA complete its projects as quickly as possible to use the methane produced at the Kent and Sussex landfills to generate electricity, and continue to operate those landfills as bioreactor landfills.”
DSWA, if directed by the Legislature, will also work toward the second prong of the Working Groups recommendation: “(that) the State should build a MSW processing facility serving New Castle County to further reduce the amount of material that is disposed of at the Cherry Island Landfill.”
The Working Group evaluated si32x potential alternative technologies currently in use or under development in the United States and around the world. These technologies included, in no particular order:
These technologies were ranked based on seven criteria:
Based on the ranking using the seven criteria the Working Group recommended two processes for further consideration. The first was anaerobic digestion, and second was waste-to-energy using a mass burn process33. A summary of the two technologies recommended by the Working Group, as well as aerobic composting, which is already in use in Delaware, is presented below, together with a discussion on how these technologies might, or might not be compatible with zero waste concepts. Details on other alternatives are available in the Working Group report34.
Aerobic Composting
DNREC currently operates three community yard waste drop-off locations in New Castle County. The DSWA currently operates Gore composting facilities at the Cherry Island and Jones Crossroads landfills. In addition, the Peninsula Composting Group just opened a 160,000 ton per year, privately owned and operated composting facility (WORC) on Christiana Avenue, across Christina River from the Cherry Island landfill. This facility will be sourcing organic rich loads from Delaware as well as the surrounding region, and could significantly help with increasing diversion of organics from the Cherry Island landfill. Finally, Bruce Blessing operates a large scale organics composting facility near Milford serving, primarily Kent and Sussex Counties, and Blue Hen organics operates a large scale composting facility near Millsboro.
In general, composting uses oxygen loving bacteria to decompose organic materials. The resulting decomposed material can be used as a soil conditioner as long as the compost meets minimum standards for contaminants and decomposition.
There are two primary types of composting facilities. The most common are windrow composting facilities where the organic material is piled in windrows and turned as necessary to assure that the piles stay aerobic, and maintain proper moisture content and temperatures. At the end of the composting process the material must be cured and screened prior to its use as compost.
Composting of large quantities of organic material in outdoor windrows requires significant land area, and can result in odor problems – especially under high humidity and temperature days in the summer. These problems can be minimized by composting in an enclosed vessel, where temperature, moisture content and oxygen content can be better controlled, reducing odors and increasing the quality of the resulting compost. DSWA and the WORC both use the Gore cover technology to cover the windrows, and to control the composting process. The Blessing and Blue Hen facilities use static pile and windrows to control the composting operation.
The key to composting is to obtain a relatively clean, organic rich input stream that is also low in heavy metals and other potential contaminants. Yard wastes, and supermarket loads of spoiled vegetables and meats, are an excellent source of this type of material. However, it is unlikely that the Wilmington WWTP sludge will be an acceptable input to either the DSWA yard waste composting operations or the new WORC.
Anaerobic Digestion
Anaerobic digestion uses bacteria to decompose organic wastes. However, unlike composting which relies on aerobic bacteria (bacteria that rely on oxygen to survive and grow) anaerobic bacteria do not use oxygen to survive. With anaerobic digestion the gases produced during the decomposition of the organic wastes contain methane, which can be used as a fuel – either directly to power equipment, or heating or cooling system, or indirectly to produce electricity.
The benefits of anaerobic digestion over composting are:
The United States has significant experience with anaerobic digestion of sewage sludge and animal manures, but there are no plants operating in the United States digesting organic rich MSW streams. There are, however, a growing number of anaerobic digestion facilities in Europe and Asia that do process organic rich MSW streams.
The disadvantage of anaerobic digestion is that capital and operating costs are significantly higher than for an aerobic composting facility, requiring higher throughputs and favorable energy rates to realize economies of scale necessary to compete with other recycling or disposal options.
The need to source sufficient organic rich waste to realize economies of scale also raises a concern at this time as to whether significant organic material exists to supply both the Wilmington Organics Recycling Center and a new anaerobic digestion facility.
Waste-to-Energy
According to the Working Group, over 16 percent of the MSW in the United States is processed through mass burn and refuse derived fuel waste-to-energy plants. There are 89 waste-to-energy plants currently operating in the United States. In some eastern states, such as Connecticut and Massachusetts over 50 percent of all MSW is processed through waste-to-energy plants.
The primary benefits of waste-to-energy plants are:
Disadvantages of waste-to-energy include:
The other three technologies (autoclave, gasification and plasma arc) were not recommended by the Working Group based on the lack of operating plants, and technological and financial risks.
In conclusion, given current investments in landfill capacity, private development of a large composting facility immediately adjacent to Cherry Island landfill capable of managing organic rich solid waste, and the prohibition of waste-to-energy facilities under current statute, DSWA does not propose to construct any large scale technology for processing solid waste at this time, but is prepared to move forward on the Working Group recommendations if directed to do so by the Legislature.
CHAPTER 6
Landfills
DSWA has long been a leader in the United States in landfill siting, development and operations. DSWA’s efforts have resulted in sufficient landfill design capacity in Delaware to last at least 30 more years at current landfill utilization rates. Increased diversion of materials and organics as proposed in this Plan will significantly increase the lifetime of this valuable resource for Delaware.
History and Size
The Sandtown landfill, was the first of the three currently operating DSWA landfills to open, beginning operations in October 1980. This was followed by the Jones Crossroads landfill in 1984 and the Cherry Island landfill in 1985 (after closure of the Pigeon Point landfill).
The Sandtown landfill currently encompasses a total of 835 acres, of which 101 acres are in use, or are closed landfill cells; 187 acres are reserved for future landfill cells; and, 547 acres are buffer areas. DSWA began recirculating leachate at the Sandtown landfill in 1982, and all landfill cells have been designed as bioreactor cells. The landfill has a current design capacity of 20.43 million tons, of which 3.7 million tons have been utilized.
The Jones Crossroads landfill currently encompasses 572 total acres, of which 95 acres are in use or are closed landfill cells, 130 acres are reserved for future landfill cells, and the remaining 347 acres are buffer areas. The Jones Crossroads landfill was one of the first municipal landfills in the United States to have a double synthetic liner system, and landfill leachate recirculation began in 1985 with all cells designed as bioreactor cells, although operation of cells as bioreactors is limited by permit or operational constraints. The landfill has a design capacity of 29.5 million tons, of which 4.2 million tons have been utilized.
The Cherry Island landfill is comprised of 513 total acres, of which 219 acres are in active landfill cells, and 294 acres are buffer area. The Cherry Island landfill is constructed on dredge spoils, which are highly impermeable soils. To prevent uneven settlement, and because of the highly impermeable base soils, the Cherry Island landfill does not have individually lined cells. The landfill has a permitted design capacity of 24.9 million tons, of which 10.9 million tons have been utilized.
Estimated Landfill Lifetimes
DSWA continuously updates its estimates of landfill lifetimes based on current and projected disposal rates, compaction and decomposition rates, and permitted versus theoretical vertical and horizontal fill limits. Based on current rates of fill and design capacity, DSWA estimates that there is a minimum of 30 years of additional landfill life available to DSWA. Table 6-1 summarizes current estimates of landfill capacity under current rates of fill by facility.
Table 6-1 Estimated Lifetime, DSWA Landfills

Greenhouse Gas Emissions
DSWA takes active steps to control and capture methane and other landfill gases generated at the three landfills, with all three landfills currently capturing landfill gas for green power production.
DSWA opened a landfill gas utilization facility at Cherry Island in 1995 which takes landfill gas and sends it by pipeline to Conectiv for use in the production of electricity. Landfill gas to energy plants were constructed at Sandtown and Jones Crossroads landfills in 2007, which produce 3 and 4 MW of electricity, respectively.
DSWA has calculated the carbon equivalent emissions from the three landfills using the U.S. Department of Energy, “Technical Guidelines, Voluntary Reporting of Greenhouse Gases (1605(b)) Program”. According to the Technical Guidelines, landfill emissions are addressed in the following ways:
CHAPTER 7
Management Plan
As stated in the 2006 Working Group report, Solid Waste Management Alternatives for Delaware, “the primary solid waste issue facing Delaware, is how the state can most effectively and economically preserve the valuable landfill capacity it has”. Delaware’s landfill capacity is a legacy that DSWA can be proud of, providing sufficient design capacity for the next thirty years. This Plan represents DSWA’s commitment to an integrated solid waste management system for Delaware that maximizes diversion of materials and organics for beneficial reuse, and prolongs the lifetime of the existing landfill capacity by as much as an additional 25 years.35 The value of extending DSWA landfill lifetimes by as much as 25 years are both quantifiable (in terms of avoided closure costs for existing landfills and siting and development costs for new landfills) as well as unquantifiable in terms of Delaware maintaining control of their waste management destiny, and avoiding the difficulties of siting a new landfill.
For the first time in DSWA history there have been declines in waste disposal at DSWA facilities over the past two years. While these declines are primarily the result of a severe economic recession, they are also the result of significant increases in diversion of residential recyclables through Wilmington and DSWA’s single stream collection programs, together with a ban on the landfilling of yard waste at the Cherry Island landfill.
The declines in tonnage have required DSWA to mount an aggressive effort to reduce costs in the face of declining revenues from disposal, given the relatively fixed costs associated with developing and operating landfills. This effort is on-going, and is important in addressing House Joint Resolution No. 5, proposed during the 2009 Legislative Session requesting that the Department of Natural Resources and Environmental Control (DNREC) and DSWA “enter into discussions leading to a plan with enabling legislation to be delivered to the Legislature of the State of Delaware”.
DSWA agreed with DNREC that DSWA would develop an integrated solid waste management plan incorporating zero waste principles for review by DNREC and presentation to the General Assembly. This document represents DSWA’s ten-year plan, incorporating zero waste principles, to provide the framework for actions to be taken by DSWA and other stakeholders in Delaware to reduce waste generation and maximize diversion of materials from landfill disposal.
Moving Toward Zero Waste
Zero waste is an ideal, based on the main principle that many of the materials currently disposed could, and should be diverted for recovery to reduce the environmental impacts associated with the production of new materials.
Zero waste principles are not achieved immediately. They will require significant changes in legislation, policy, services and programs, as well as changes in the behavior of residents and businesses throughout Delaware. They will also require significant
investment in infrastructure, and will result in higher overall waste management costs in the short term, but will also result in significant environmental and jobs benefits going forward. One of the key zero waste principals is that there are significant externalities associated with mining and using virgin resources that are not necessarily recognized by current economic accounting systems. Issues such as the loss of biological diversity, increased worldwide competition for scarce resources, and the full impact of climate change all argue for increased diversion of materials even if the short term costs appear to be greater than the cost of disposal.
Investment in infrastructure will have to primarily come from the private sector, and will have to be funded from new sources of revenues, for two reasons. First, the private sector owns and operates the majority of the solid waste and recycling collection infrastructure in Delaware, and therefore must take the lead in the investments necessary to separately collect additional materials and organics. The private sector also owns the majority of materials and organics processing capacity in Delaware, and therefore is best suited to expand and develop the processing capacity necessary to divert additional materials.
Second, declining tonnage for disposal will require DSWA to both continue its efforts to reduce costs, as well as to control tipping fees. This will require DSWA to significantly reduce surcharges on the tipping fee to subsidize programs. This will be replaced by private sector, free market costs for new and expanded diversion programs.
Chapters 3 and 4 establish the framework for the waste reduction and diversion action plans summarized below. The action plans presented in this Chapter are data driven, based on current disposal quantities by material type, which is available from the Statewide Waste Characterization Study, 2006 – 2007, adjusted for declining tonnages in 2008 and 2009, as well as current materials recovery by material type, as reported in the Annual RPAC recycling rate reports. When combined, these two reports establish both where the potential lies for significantly increasing recovery as well as realistic maximum diversion under aggressive diversion programs.
Appendix Tables A-1 through A-3 present detailed annual tonnage estimates by material type, current recovery rates, and potential recovery rates necessary to move toward zero waste goals. Appendix Table A-1, which presents estimated current recovery by material type, is based on CY 2008 material recovery rates. Appendix Table A-2, which presents detailed estimates of disposal (tons) by material type is also based on CY 2008 and includes all MSW and C&D waste generated in Delaware, including C&D waste disposed at the DRPI landfill.
Finally, Appendix Table A-3 presents potential future recovery by material type, by sector (e.g. residential, commercial or other), applying aggressive recovery rate goals for each material type that could be recycled or composted.36
Table 7-1 summarizes the resulting recycling rates based on the high recovery rates assumed in Appendix Table A-3 for MSW, and for All Waste. Table 7-1 illustrates that a diversion goal of 82 percent of total solid waste is technically achievable, and will result in an estimated MSW recycling rate of 55 percent.
Table 7-1 Summary of Potentially Achievable Diversion Goals
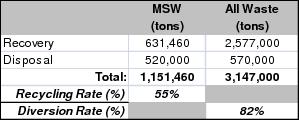
Table 7-2 summarizes the increase in recovery that would be necessary, by material type (highlighted in blue), to achieve these aggressive diversion rates. Table 7-3 then presents current and necessary recovery rates by broad category, and the resulting drop in material landfilled, to demonstrate that an 82 percent diversion goal is technically feasible assuming that Delaware is willing to make the necessary investments in infrastructure and institutional changes.
Table 7-2 Current and Future Recovery, by Material Type, Necessary to Reach Zero Waste Goals (Annual Tons)
Current (1) | Future (2) | Increase | |
Materials | (tons) | (tons) | (%) |
Paper |
|
|
|
Newspaper | 11,200 | 34,000 | 204% |
Cardboard | 76,500 | 121,600 | 59% |
Mixed Paper | 30,300 | 71,000 | 134% |
Packaging |
|
|
|
Containers (3) | 15,600 | 47,920 | 207% |
Pallets (4) | 20,900 | 37,600 | 80% |
Shrink Wrap/Film | 2,000 | 7,800 | 290% |
Organics |
| ||
Food Waste | 5,700 | 72,000 | 1163% |
Leaf and Yard Waste | 67,200 | 119,000 | 77% |
Trees and Branches | 55,200 | 55,200 | 0% |
Compostable Paper | 0 | 35,900 |
|
Other MSW |
| ||
Vehicle Wastes | 13,160 | 13,160 | 0% |
Special Wastes (5) | 5,290 | 29,135 | 451% |
C&D |
| ||
Clean Gypsum | (2) | 24,000 | (2) |
Clean Wood | (2) | 36,000 | (2) |
Other Wood, Except Treated | (2) | 60,000 | (2) |
Mixed C&D | 59,640 | 98,000 | 64% |
Asphalt, Concrete, Soils, Stone and Land Clearing | 861,700 | 861,700 | 0% |
Other Material Categories |
| ||
Other Organics (6) | 482,200 | 482,300 | 0% |
Metals | 98,420 | 123,000 | 25% |
Industrial Waste (7) | 247,250 | 247,550 | 0% |
Total, All Materials: | 2,052,000 | 2,577,000 | 26% |
TABLE 7-2 NOTES: | |||
(1) All recovery estimates are rounded. Numbers may not add due to rounding. | |||
(2) Included in mixed C&D for current recovery. Increases cannot be calculated. | |||
(3) Glass, aluminum, steel and plastic bottles and cans. | |||
(4) Includes pallets not classified as MSW recovery in total recovery. | |||
(5) Carpet, textiles, and electronics. | |||
(6) Poultry waste, poultry litter, and food processing wastes. | |||
(7) Mixed plastics, biosolids, bottom and fly ash and slag. | |||
Table 7-3 Current and Projected Recovery, by Major Material Category, and the Associated Statewide Diversion Rates
| Current | Projected | Change |
Major Material Category | (tons) | (tons) | (%) |
Paper | 118,000 | 226,600 | 92% |
Packaging | 38,500 | 93,320 | 142% |
Vehicle/Special Wastes | 18,450 | 42,295 | 129% |
Organics (1) | 610,300 | 764,400 | 25% |
Metals | 98,420 | 123,000 | 25% |
C&D Materials (2) | 921,340 | 1,079,700 | 17% |
Industrial Waste | 247,250 | 247,550 | 0% |
Total Recovery: | 2,052,000 | 2,577,000 | 26% |
Disposal: | 1,094,600 | 570,000 | -48% |
Diversion Rate: | 65% | 82% | |
TABLE 7-3 NOTES: | |||
(1) Includes food, yard waste, tree, compostable paper and poultry wastes and litter accounted for in Table 7-2. | |||
(2) Includes all C&D Materials shown in Table 7-2. | |||
In order to achieve an 82 percent goal over the next ten years, the time to begin these changes is now to ensure that Delaware moves toward the zero waste goals. The following action plan recognizes the need to incorporate major changes in materials management in Delaware, including increased efforts to reduce waste generation, coupled with aggressive actions to increase materials and organics diversion. Some of these actions can be implemented by DSWA, or by the private sector, while others will require legislative or regulatory changes.
Action Plan
This action plan is organized into five major categories. It begins with actions to reduce waste generation at the source (source reduction), which is often the most difficult category in which to achieve significant change, because many of the actions require changes to people’s behavior. Actions to increase recovery of materials from residential sources, and from commercial sources, are then presented, followed by actions to significantly increase diversion of organics from both residential and commercial activities. Finally, actions to increase diversion of C&D wastes are presented.
The action plan for each of the five categories is organized from easiest to hardest to implement, with the results dependant on the exact form of implementation.
Source Reduction
Residential Recycling and Diversion
Commercial Recycling
Organics Recovery
Construction and Demolition Waste Diversion
Interim Goals
Interim goals are important to measure progress toward achieving the long term goals established in this Plan. Interim goals have been established for year five (2015) of this Plan. These goals assume the following three major actions are taken during the first five years of this Plan:
Table 7-4 presents the assumed change in material diversion associated with these three actions. The biggest increase expected in the first five years is from universal recycling (an estimated 37,700 tons), which assumes that at least 60 percent of the population fully participates in recycling by 2015. This is followed by major increases in food waste diversion to compositing (an estimated 29,300 tons) and finally by yard waste diversion as a result of an enacted yard waste ban at all DSWA facilities (an estimated 24,100 tons).
Table 7-4 Interim Goals and Estimated Tons Diverted
DIVERSION | Current | Mid | 10 years |
Year | 2009 | 2015 | 2020 |
Major Measures | (tons) | (tons) | (tons) |
Universal Recycling | 30,800 | 68,500 | 105,800 |
Yard Waste Diversion | 67,200 | 91,300 | 119,000 |
Food Waste Composting | 5,700 | 35,000 | 72,000 |
Subtotal: | 103,700 | 194,800 | 296,800 |
In addition to the significant increases in diversion presented in Table 7-4, some progress toward greater diversion of other materials is also assumed to occur during the first five years. This includes increases in recycling over current levels of between 10 and 25 percent for each category of materials targeted. These estimated tonnages are presented in detail in Appendix Table A-6.
Legislative Actions
Many of the key waste diversion actions required to meet the diversion goals laid out in this plan require legislative actions. Key actions include the following:
Benefits and Impacts
Reductions in Greenhouse Gas (GHG) Emissions
Materials recovery is an important way to preserve the embedded energy associated with mining, milling, transporting and producing new materials. These embedded energy savings produce significant savings in world-wide GHG emissions. In addition, diversion of organic material to composting, anaerobic digestion or waste-to-energy reduces methane – a potent GHG - generation in the operating cells at DSWA landfills where it is more difficult to control than in later phases of landfill management when landfill gas is more easily captured.
The U.S. EPA WARM Model was used to estimate reductions in greenhouse gas emissions (GHG) from recycling of different materials and from different waste management scenarios for each material type.39
Tables 7-5 and 7-6 present the estimated emission reductions from current and future recovery, respectively, of recyclable and compostable materials in Delaware. Emissions reductions presented in Tables 7-5 and 7-6 are a subset of total materials recovery in Delaware, focusing only on the materials where new programs in the residential and commercial sectors (MSW) will need to be instituted.
As illustrated by Tables 7-5 and 7-6, achieving a 55 percent recycling rate for MSW would result in a net reduction in annual GHG emissions of 143,000 metric tonnes, carbon equivalent emissions.40 This is the same as taking 93,225 cars off the road in Delaware each year, or conserving 57.8 million gallons of gasoline per year.
Table 7-5 GHG Emissions Reductions from Current Recovery in Delaware, in Metric Tons Carbon Equivalent (MTCE)
Commodity | Tons Recycled | Tons Landfilled | Tons Composted | Total MTCE |
Aluminum Cans | 339 | 7,961 | NA | (1,176) |
Steel Cans | 2,463 | 7,637 | NA | (1,127) |
Glass | 11,366 | 18,334 | NA | (672) |
HDPE | 658 | 8,912 | NA | (158) |
PET | 526 | 7,304 | NA | (146) |
Corrugated Cardboard | 73,677 | 88,323 | NA | (53,102) |
Newspaper | 10,934 | 34,766 | NA | (16,623) |
Food Scraps | NA | 101,450 | 5,650 | 19,437 |
Yard Trimmings | NA | 65,191 | 67,109 | (6,877) |
Branches | NA | 1,452 | 56,748 | (3,263) |
Mixed Paper, Residuals | 12,803 | 35,000 | NA | (10,033) |
Mixed Paper, Office | 16,311 | 30,600 | NA | (11,630) |
GHG Emissions from Current Recovery (MTCE): | (85,425) |
Table 7-6 GHG Emissions Reductions from Future Recovery In Delaware, in Metric Tons Carbon Equivalent (MTCE)
Commodity | Tons Source Reduced | Tons Recycled | Tons Landfilled | Tons Composted | Total MTCE |
Aluminum Cans | 0 | 5,000 | 3,300 | NA | (18,552) |
Steel Cans | 0 | 5,620 | 4,480 | NA | (2,707) |
Glass | 0 | 24,000 | 5,700 | NA | (1,765) |
HDPE | 0 | 5,000 | 4,570 | NA | (1,866) |
PET | 0 | 5,000 | 2,830 | NA | (2,085) |
Corrugated Cardboard | 0 | 121,600 | 40,400 | NA | (98,688) |
Newspaper | 0 | 34,000 | 11,700 | NA | (28,719) |
Food Scraps | 8,000 | NA | 27,100 | 72,000 | 1,383 |
Yard Trimmings | 0 | NA | 13,300 | 119,000 | (7,094) |
Branches | 0 | NA | 5,527 | 52,673 | (3,594) |
Mixed Paper, Residuals | NA | 39,500 | 8,303 | NA | (37,243) |
Mixed Paper, Office | NA | 31,500 | 15,411 | NA | (27,570) |
GHG Emissions from Future Recovery (MTCE): |
| (228,499) | |||
Reductions in Natural Resource Depletion
The recovery of materials from recycling replaces the need to mine new materials, reducing the ecological and environmental impacts of mining. For example, the mining of bauxite in Jamaica, one of the leading suppliers of bauxite, has created significant ecological devastation to a significant part of the island, and hard rock mining in the United States has resulted in many of the largest hazardous waste superfund sites in the U.S. Similarly, the cutting of trees to produce construction materials and paper products reduces ecological diversity, while simultaneously reducing the ability to sequester GHG emissions.
Increased Supplies of Material to United States Manufacturers
Manufacturers in the United States have to compete in a global marketplace. A significant amount of material recovered for recycling in the United States is shipped to Asia for remanufacturing, often resulting in inexpensive imports which are difficult for U.S. manufacturers to compete against.
As a consequence manufacturers in the U.S. all report a need for additional secondary materials to allow them to invest in the new processing and manufacturing capacity that they need to use secondary materials and to remain competitive in a world-wide economy.
Jobs
Recovery of materials and organics from Delaware provides the potential to increase jobs in Delaware, both as a result of separate collection and processing of these materials, and potentially from production of new materials from the reclaimed materials. The 2009 Northeast Recycling Council (Recycling Economic Information) Study indicated that the current recycling, reuse and remanufacturing industry in Delaware employs 1,330 people with an annual payroll of $32.2 million, and that manufacturers in Delaware that rely on recycled material inputs employ an additional 545 people with an annual payroll of $24.4 million.41 It is estimated that if Delaware were to increase recycling as laid out in this Plan an additional 1050 jobs would be created in Delaware, representing an additional annual payroll of $44 million.42
Management of DSWA Budgets and Facilities with Declining Tonnage
Continued reductions in tonnage disposed at DSWA facilities will present significant financial challenges to DSWA given the relatively large fixed costs associated with construction and post closure care of its three landfills. However, DSWA believes that it can meet these challenges and maintain its current infrastructure through the following actions.
DSWA is also prepared to continue to cut operating costs to bring costs in line with reduced revenues. As part of this planning process DSWA has prepared contingency budgets looking forward to 2015 and 2020 under the following three scenarios.
Appendix Table A-7 presents estimated tipping fees for these three scenarios in 2015 (FY 16) and 2020 (FY 20). Based on the assumptions made in projecting future capital and operational expenses, and assuming an annual inflation rate of three percent, achieving the diversion goals outlined in this plan will not cause a significant increase in the estimated tipping fee DSWA would have to charge.
To assure the proper management of the solid waste and provide sufficient financial support for its programs, DSWA is authorized to control the collection, transportation, storage and disposal of solid waste throughout the State.
DSWA has extensive authority to utilize services provided by the private sector and to engage in cooperative arrangements with other State entities, counties and municipalities. DSWA has also been charged with establishing an extensive recycling program and a public education program. Included in the recycling initiative is the removal of materials from the solid waste stream which are harmful to the environment, and which cannot be recycled, so that they are disposed in an authorized manner. In order to fund these comprehensive activities, DSWA charges user fees for the services it provides and borrows money through bond financing and otherwise. DSWA receives no State or federal funding, and the full faith and credit of the State is not pledged for any of DSWA's debt. To assure the proper management of the solid waste and provide sufficient financial support for its programs, DSWA is authorized to control the collection, transportation, storage and disposal of solid waste throughout the State, and is expressly authorized, pursuant to 7 Del.C. §6406(a)(31) to "control through regulation or otherwise, the collection, transportation, storage and disposal of solid waste, including the diversion of solid waste within specified geographic areas to facilities owned, operated or controlled by the Authority". Also, 7 Del.C. §6422(b) authorizes DSWA, by rule or regulation, to "require the owners and occupants of all lands, buildings and premises [in Delaware] to use the services and facilities of the Authority under such rules and regulations as the Authority shall fix and establish."
Beyond assuring a steady and consistent source of revenue, the DSWA has also determined that maximizing disposal of Delaware-generated solid waste in DSWA facilities will better assist DSWA in its efforts to monitor, evaluate and police the system of solid waste management in Delaware, including such issues as proper waste disposal, waste volume reduction, use of recycling programs and the full capture of those recyclables that may become available in the future.
In carrying out its broad statutory responsibilities to comprehensively manage solid waste on a statewide basis for the benefit of the people of the State of Delaware, the DSWA has undertaken a multitude of operations and projects, including but not limited to the following:
1. The design, construction and operation of a modern landfill at Cherry Island to serve the needs of New Castle County;
2. The acquisition, retrofitting and operation of a landfill gas processing plant at Cherry Island, and the transmission of such landfill gas to power renewable energy projects in New Castle County;
3. The design, construction and operation of a solid waste transfer station at Pine Tree Corners in New Castle County;
4. The design, construction and operation of a modern landfill at Sandtown to serve the needs of Kent County;
5. The acquisition, retrofitting and operation of a landfill gas processing plant at Sandtown, and the utilization of such landfill gas to generate electricity;
6. The design, construction and operation of a solid waste transfer station at Milford, Delaware;
7. The design, construction and operation of a modern landfill at Jones Crossroads to serve the needs of Sussex County;
8. The acquisition, retrofitting and operation of a landfill gas processing plant at Jones Crossroads, and the utilization of such landfill gas to generate electricity;
9. The construction of a pilot project at Jones Crossroads for evaluation of closed cells as suitable for installation of a solar energy array;
10. The design, construction and operation of a solid waste transfer station at Route 5, Sussex County Delaware;
11. The operation of a source separated drop-off recycling program with 142 drop-off centers statewide;
12. Contracting for two materials recovery facilities, one for household and commercial recyclables and the other for construction and demolition materials, at DSWA’s Delaware Recycling Center and Transfer Station at the former landfill location at Pigeon Point, New Castle County, Delaware;
13. The design, construction and operation of yard waste composting systems at the Cherry Island and Jones Crossroads landfills, and the operation of yard waste mulching systems at all DSWA landfills;
14. Issuing and servicing approximately $140 million in bonds issued between 2006 and 2010;
15. Reserving and planning for long-term landfill post-closure care obligations for DSWA’s three active landfills;
16. Maintaining post-closure care of the former Pigeon Point Landfill.
By establishing and maintaining multiple facilities, DSWA provides an indispensible convenience to the public and, in so doing, prevents the air pollution, noise pollution and road congestion that would otherwise result if haulers and the public were forced to travel long distances to deposit waste. Additionally, many of the DSWA’s activities are essential waste disposal functions that do not result in revenue generation and are not typically performed by private entities in the waste disposal business. These activities include:
1. The establishment and operation of a public education and public outreach program which includes school and community presentations, distribution of books and educational materials, participation in public events, use of slogans and themes, use of a mascot, and public advertising.
2. Coordination and participation in solid waste and recycling activities with State, county, municipal, local and civic organizations throughout the State.
3. The collection and proper disposal of household hazardous wastes and document shredding at eight (8) scheduled events conducted throughout the State.
4. The operation of a recycling program for electronic goods at twelve (12) drop off locations throughout the State.
5. The operation of a recycling program at DSWA transfer stations and landfills which involves the separation and recycling of tires, drywall, textiles, used oil, oil filters, batteries and white goods including refrigerators that must be drained of chlorofluorocarbons to be recycled.
The implementation and management of these programs comes at significant cost; yet continued reductions in tonnage disposed at DSWA facilities will present significant financial challenges to DSWA given the cost of these programs and the relatively large fixed costs associated with construction and post closure care of its three landfills. Accordingly, in addition to those measures identified in the section under Chapter 7 of the Statewide Solid Waste Management Plan, entitled Management of DSWA Budgets and Facilities with Declining Tonnage, DSWA is taking the following additional actions.
DSWA also continues to cut administrative costs to bring its expenses more in line with reduced revenues. However, notwithstanding efforts to trim its budgets and operating costs, DSWA will from time to time be required to increase landfill tipping fees and other user fees, and to design and implement policies that: (i) are responsive to marketplace conditions, (ii) will incentivize generators haulers and municipalities to use DSWA facilities, and (iii) maximize the recycling and disposal of Delaware generated solid waste at DSWA facilities. These incentives may include but are not limited to:
Indeed, user fees have been and will continue to be the basic source of revenue to fund DSWA operations and debt service. For many years, DSWA has ensured that all Delaware-generated solid waste is brought to DSWA facilities through the use of attractive contract terms and pricing that incentivized haulers to bring this waste to DSWA facilities. In so doing, DSWA has ensured that Delaware waste generates DSWA user fees in amounts sufficient to fund all of the operations and projects identified above. DSWA desires to continue this practice and may enter into any contract with any hauler at any time to the extent that DSWA, in its discretion, determines that such contract will serve the needs of the DSWA and the State of Delaware. However, if DSWA is unable to secure contractual arrangements with the haulers that will keep Delaware waste coming to DSWA facilities, DSWA may invoke its authority under 7 Del.C. §6422(b), and to require by regulation that all Delaware generated waste be directed to DSWA facilities. The requirements of any such regulation may be imposed independently of, or in conjunction with, contractual arrangements with haulers as determined by DSWA in its discretion.
APPENDIX
Integrated Solid Waste Management Plan for Delaware: Moving Toward Zero Waste
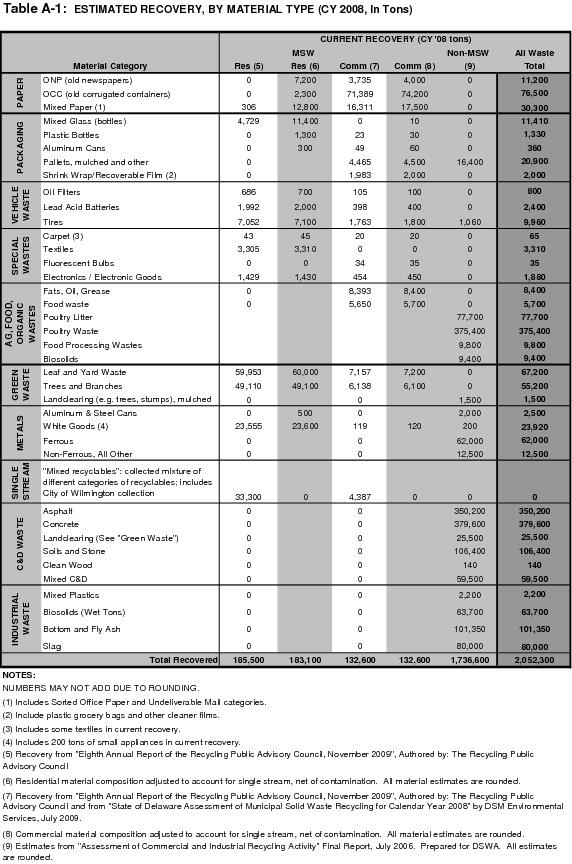
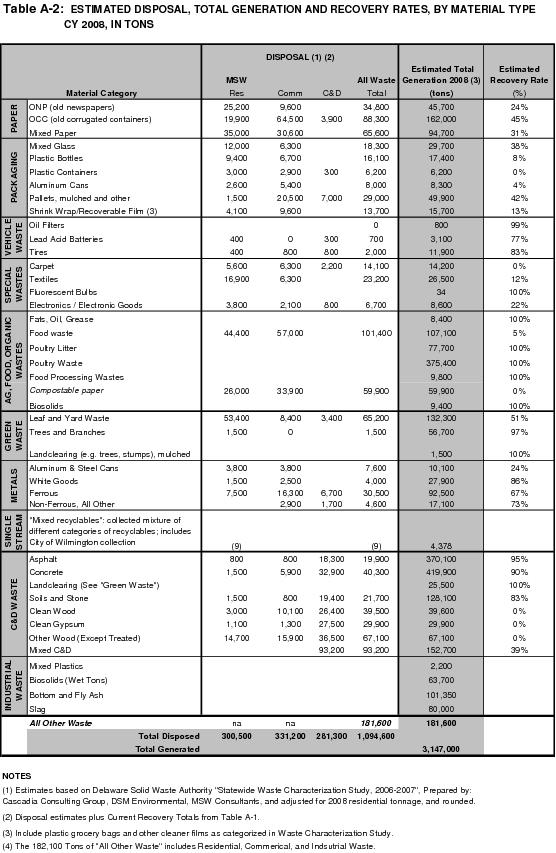
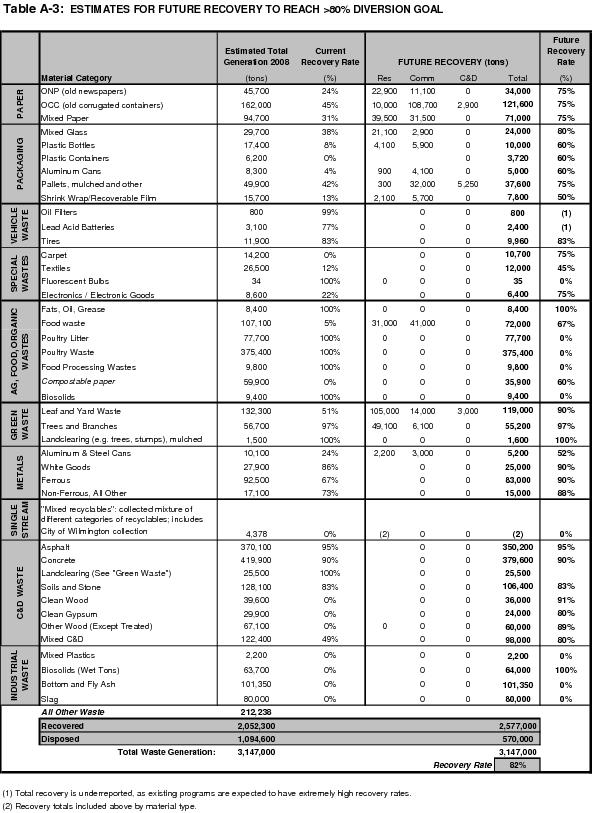
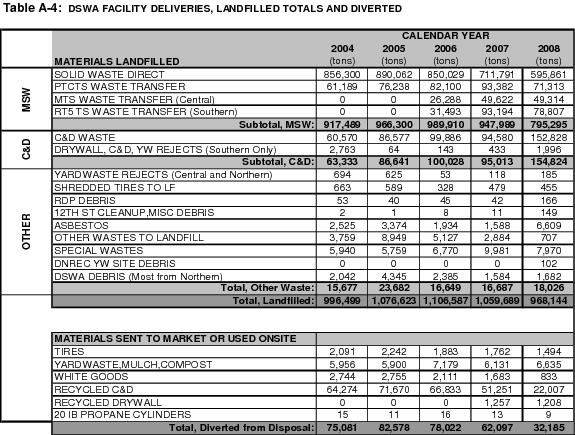
Table A-5: DESCRIPTIONS FOR TABLE A-4
CATEGORY | DESCRIPTION |
MSW and C&D DISPOSAL: |
|
SOLID WASTE DIRECT: | Solid Waste received for landfilling |
PTCTS WASTE TRANSFER: | Solid Waste hauled from the PTCTS to the CSWMC for landfilling. |
MTS WASTE TRANSFER (Central): | Solid Waste hauled from the MTS to the CSWMC for landfilling. |
RT5 TS WASTE TRANSFER (Southern): | Solid Waste hauled from the RT5 TS to the SSWMC for landfilling. |
C&D WASTE: | Material weighed in as C&D materials by the weighmaster, and disposed on-site. |
DRYWALL, C&D, YW REJECTS (Southern Only): | Includes rejects from the drywall, C&D, and yardwaste stockpile areas that were landfilled. |
OTHER WASTE DISPOSAL: |
|
YARDWASTE REJECTS (Central and Northern): | Off-specification material dropped of at the yardwaste stockpile area for disposal in the landfill. |
SHREDDED TIRES TO LF: | Shredded tires sent to the landfill |
RDP DEBRIS: | Debris picked up at DSWA Recycle Delaware sites for disposal in the landfill. |
12TH ST CLEANUP, MISC DEBRIS: | Trash picked up along a portion of 12th street by DSWA or contractor under permit requirement. |
ASBESTOS: | All asbestos materials landfilled. |
OTHER WASTES TO LANDFILL: | Certain special wastes that are individually tracked and not accounted elsewhere. |
SPECIAL WASTES: | Sludge, contaminated soil, industrial wastes, and other special wastes landfilled under DSWA policies. |
DNREC YW SITE DEBRIS: | Debris from DSWA yard waste drop-offs. |
DSWA DEBRIS (Most from Northern): | Debris from DSWA onsite operations and construction for disposal in the landfill. |
Table A-6: INTERIM GOALS (2015) FOR RECYCLING AND DIVERSION
DIVERSION | Current | Mid | 10 years |
Year | 2009 | 2015 | 2020 |
Major Measures | (tons) | (tons) | (tons) |
Universal Recycling | 30,800 | 68,500 | 105,800 |
Yard Waste Diversion | 67,200 | 91,300 | 119,000 |
Food Waste Composting | 5,700 | 35,000 | 72,000 |
Subtotal: | 103,700 | 194,800 | 296,800 |
Other Measures |
| ||
Commercial Recycling (Packaging) | 125,700 | 150,800 | 215,000 |
Special Waste (1) | 5,290 | 6,600 | 29,100 |
C&D (2) | 921,340 | 1,013,500 | 1,079,700 |
Trees, Branches and Comp. Paper | 55,200 | 69,000 | 91,100 |
Other Metals | 98,420 | 108,300 | 123,000 |
Subtotal: | 1,205,950 | 1,348,200 | 1,537,900 |
No Change |
| ||
All Other (3) | 742,610 | 742,610 | 742,610 |
|
| ||
Total Diverted: | 2,052,000 | 2,286,000 | 2,577,000 |
DISPOSAL |
|
|
|
Total Disposed | 1,094,600 | 860,600 | 570,000 |
DRPI Landfill | 125,000 | 100,000 | 50,000 |
Total DSWA Landfills | 969,600 | 760,600 | 520,000 |
Recycling/Diversion Rate (4): | 65% | 73% | 82% |
TABLE A-6 NOTES: | |||
(1) Carpet, textiles, and electronics which are targeted more aggressively in years 5-10. | |||
(2) Increase mainly due to wood, gypsum, and mixed C&D diversion and recycling. | |||
(3) Vehicle wastes, Poultry waste and litter, food processing wastes, biosolids, mixed plastics, bottom and fly ash and slag. | |||
(4) Some material diversion is beneficial use and not classified as recycling. | |||
Table A-7: PROJECTED LANDFILL TIPPING FEES
