
Department of Natural Resources and Environmental Control
Division of Air Quality
GENERAL NOTICE
REGISTER NOTICE
SAN# 2012-14
1. TITLE OF sip rEVISION:
State Implementation Plan (SIP) Revision: Delaware Redesignation Request and Maintenance Plan under the 1997 Annual PM2.5 National Ambient Air Quality Standard (NAAQS)
2. BRIEF SYNOPSIS OF THE SUBJECT, SUBSTANCE AND ISSUES:
Effective April 5, 2005 the EPA designated the Philadelphia-Wilmington, PA-NJ-DE area as non-attainment for the 1997 annual PM2.5 NAAQS. This area included New Castle County in Delaware; Burlington, Camden, and Gloucester Counties in New Jersey; and Bucks, Chester, Delaware, Montgomery, and Philadelphia Counties in Pennsylvania. The attainment date for this area was as expeditiously as practicable, but not later than five years from the date of designation (e.g., no later than April, 2010). In response to this non-attainment designation Delaware developed various regulations to reduce the emission of PM2.5, and its precursors of sulfur dioxide (SO2) and nitrogen oxides (NOx). Monitoring data for 2007-2011 has confirmed attainment of the daily PM2.5 NAAQS for the entire Philadelphia Area. This action begins the process of submitting to the United States Environmental Protection Agency (EPA) SIP documents that request New Castle County be redesignated to attainment for the 1997 annual PM2.5 NAAQS.
3. POSSIBLE TERMS OF THE AGENCY ACTION:
None
4. STATUTORY BASIS OR LEGAL AUTHORITY TO ACT:
7 Delaware Code, Chapter 60, Environmental Control
5. OTHER REGULATIONS THAT MAY BE AFFECTED BY THE PROPOSAL:
None
6. NOTICE OF PUBLIC COMMENT:
Interested parties may submit comments in writing to Jack Sipple, Division of Air Quality, Blue Hen Corporate Center, 655 S. Bay Road, Suite 5N, Dover, DE 19901, and/or statements and testimony may be presented either orally or in writing at the public hearing to be held on Tuesday, October 23, 2012 beginning at 6:00 pm, in DNREC???s Auditorium, R & R Building, 89 Kings Hwy, Dover, DE 19901.
7. PREPARED BY:
Jack Sipple (302) 739-9402 September 14, 2012 john.sipple@state.de.us
Delaware Redesignation Request and Maintenance Plan Under the 1997 Annual PM2.5 National Ambient Air Quality Standard State Implementation Plan For the New Castle County Portion of the Philadelphia-Wilmington, PA-NJ-DE Nonattainment Area for Fine Particles
Acronym List
AQS - EPA???s Air Quality System
CAA - Federal Clean Air Act
CAAA - Clean Air Act Amendments of 1990
CFR - Code of Federal Regulations (of the United States)
CSAPR - Cross-State Air Pollution Rule
DAQ - DNREC Division of Air Quality
DelDOT - Delaware Department of Transportation
dv - Design Value
DNREC - Delaware Department of Natural Resources and Environmental
Control
EGU - Electric Generating Unit
GDP - Gross Domestic Product
EPA - United States Environmental Protection Agency
FHWA - Federal Highway Administration
FR - United States Federal Register
FRM - Federal Reference Method
FTA - Federal Transit Authority
I/M - Inspection and Maintenance Program
MANEVU - Mid-Atlantic and Northeast Visibility Union
MARAMA - Mid-Atlantic Regional Air Management Association
NESCUAM - Northeast States for Coordinated Air Use Management
LRTP - Long Range Transportation Plan
MLK - Martin Luther King Blvd. monitor in Wilmington, Delaware
MPO - Metropolitan Planning Organization
mmBTU - Million British Thermal Unit
NAA - Non-Attainment Area
NAAQS - National Ambient Air Quality Standard
NEI - National Emission Inventory
NOx - Oxides of Nitrogen
NAA - Non-attainment area
PM2.5 - Particulate Matter with an aerodynamic diameter of 2.5 microns or less
RACM - Reasonably Available Control Measure
RACT - Reasonably Available Control Technology
RPO - Regional Planning Organization
SIP - State Implementation Plan
(SAFETEA-LU) - Safe, Accountable, Flexible, Efficient Transportation Equity Act ??? A Legacy for Users
SO2 - Sulfur Dioxide
TIP - Transportation Improvement Program
tpy - Tons per Year
TSD - Technical Supporting Document
VOC - Volatile Organic Compound
WILMAPCO - Wilmington Area Planning Council
List of Tables
Table 3-1 2007-2012 Annual Means (ug/m3)
Table 3-2 Design Values: 2007-2009, 2008-2010 and 2009-2011
Table 3-3 PM2.5 Monitoring Site General Information
Table 3-4 PM2.5 Monitor Site Specific Information
Table 4-1 Monthly Average Min, Max and Mean Temperatures and Precipitation, including Total Precipitation
Table 4-2 Philadelphia NAA annual PM2.5 averages - 2001-2011
Table 4-3 New Castle County 2002-2007 Emission Changes
Table 4-4 New Castle County 2002-2007 Emissions Comparison
Table 7-1 2007 New Castle County Emissions (tpy)
Table 8-1 Comparison of emissions for the years 2007, 2017 and 2025
Table 8-2 Reductions and % Change of NOx emissions for the years 2007, 2017 and 2025
Table 8-3 Reductions and % Change of PM2.5 emissions for the years 2007, 2017 and 2025
Table 8-4 Reductions and % Change of SO2 emissions for the years 2007, 2017 and 2025
Table 8-5 Growth Assumptions Used in Emission Inventory Projections
Table 8???6 New Castle County Maintenance Plan On-Road Mobile Source Emissions Budgets
Table 8-7 Post-2007 Emission Reductions due to Control Measures
Table 10-1 Schedule for Permit Revisions or Rule Revisions for Contingency Measures
List of Figures
Figure 2-1 Philadelphia PM2.5 Nonattainment Area Boundaries
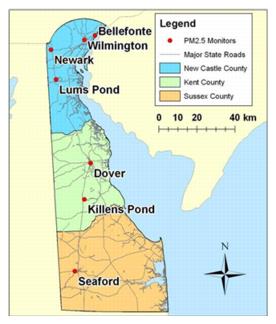
Figure 3-1 Delaware???s PM2.5 Monitoring Site Locations
Figure 4-1 2002 ??? 2011 Delaware Gross Domestic Product ??? All Industry
Figure 4-2 Philadelphia NAA ??? 2001 to 2011 annual PM2.5 trends
Figure 4-3 Philadelphia NAA ??? annual PM2.5 trends (avg. all monitors)
Figure 4-4 Philadelphia NAA ??? 2003 to 2011 PM2.5 3-Year Rolling Averages
EXECUTIVE SUMMARY
This request for redesignation to attainment and maintenance plan is a State Implementation Plan (SIP) revision for the Delaware portion1 of the Philadelphia-Wilmington, PA-NJ-DE fine particulate matter (PM2.5) nonattainment area (Philadelphia NAA). This area was designated as a nonattainment area on January 5, 2005 (70 FR 944), with an effective date of April 5, 2005.
CAAA Section 107 establishes specific requirements to be met in order for a nonattainment area to be considered for redesignation to attainment. Section 107 includes a requirement for an approved Maintenance Plan before an area can be redesignated from nonattainment to attainment of a National Ambient Air Quality Standard (NAAQS). This redesignation request and maintenance plan SIP revision provides technical information that supports this request to redesignate the Delaware portion of the Philadelphia NAA area to attainment of the 1997 annual PM2.5 NAAQS.
PM2.5 air quality has improved in New Castle County as a result of the implementation of State and Federal emissions control measures. The air quality improvement is due to permanent and enforceable emissions control measures. The entire Philadelphia NAA has certified and quality assured ambient air quality monitoring data for the 3-year periods 2007-2009, 2008-2010 and 2009-2011 that all demonstrate attainment of the 1997 PM2.5 NAAQS. The purpose of this redesignation request and maintenance plan is to request that the United States Environmental Protection Agency (EPA) redesignate the Delaware portion of the Philadelphia NAA to attainment for this standard pursuant to the provisions of Section 107 of the federal Clean Air Act (CAA) (42 U.S.C. 7407). In summary, the plan includes:
Based on this presentation, New Castle County, Delaware meets the requirements for redesignation under the CAA (Section 107(d)(3)) and EPA guidance for fine particles. Consistent with the authority granted to EPA, the State of Delaware requests that New Castle County, Delaware be redesignated to attainment for the 1997 annual fine particles standard simultaneously with EPA approval of this Delaware State redesignation request and Maintenance Plan for the New Castle County portion of the Philadelphia NAA.
1 Introduction
The State of Delaware requests that the EPA redesignate the Delaware portion of Philadelphia NAA to attainment for the 1997 annual PM2.5 NAAQS pursuant to the provisions Section 107 of the CAA (42 U.S.C. 7407).2 Since the designations for the 1997 NAAQS for this pollutant were published, the area???s PM2.5 air quality has improved due to permanent and enforceable emission reductions. Air quality in the area is significantly better than required by this standard. This document demonstrates that PM2.5 air quality in the Philadelphia area will remain compliant with the 1997 annual PM2.5 NAAQS, as measured by a monitoring network that meets all federal requirements, through 2025.
Delaware is also requesting that EPA concurrently approve, as a revision to the Delaware state implementation plan (SIP), the related Section 175A maintenance plan, as described in Sections 6-8 of this document. This plan includes mobile vehicle emissions budgets for the interim year of 2017 and the out year of 2025. It also contains contingency measures that will be implemented in the unlikely event that the area experiences an exceedance of the 1997 PM2.5 NAAQS. The maintenance plan ensures that good PM2.5 air quality will be maintained through 2025.
1.1 Documentation Organization
This document presents Delaware???s discussions and analysis of summarized air quality data and emission inventories, PM2.5 control measures and applicable CAA and EPA requirements in support of Delaware???s request for redesignation to attainment under the 1997 annual PM2.5 NAAQS. Supporting documentation and data, such as Technical Support Documents (TSD), calculation spreadsheets, model input and output files, and other related data are available on the CD enclosed with this redesignation request and maintenance plan. Much of the documentation that is referenced in the report, but not contained on the CD, has been compiled in electronic files located at the Division of Air Quality offices in Dover, Delaware and are available for review upon request by the public.
2 Background
2.1 Health Effects
PM2.5, also known as fine particulate matter or fine particles, is defined as any airborne particle of solid or liquid matter that is less than or equal to 2.5 micrometers in diameter. PM2.5 is not a single pollutant, but is a sum of all pollutants that have diameters less than 2.5 micrometers. For reference, 2.5 micrometers is about 1/30th the diameter of a human hair.
Sources of PM2.5 and PM2.5 precursors include, most significantly, coal-fired power plants and other combustion sources, fires, emissions from motor vehicles, windblown dust, and natural emissions from trees and the oceans. These sources can be divided up into two types of sources; primary and secondary. Primary sources directly emit fine particulate matter into the atmosphere without any chemical change occurring to the pollutant. Secondary sources are sources from which precursor chemical species are released into the atmosphere, which then react with other chemical species in the atmosphere to create fine particulate matter. Some species which comprise fine particulate matter are sulfates, ammonium nitrate, soot, sea salt, organic carbon, elemental carbon and metals (crustal metals, transitional metals, and potassium).
Exposure to high levels of PM2.5 adversely affects human health. The main impacts of PM2.5 on human health are on the respiratory system and the cardiovascular system. Children, the elderly, and individuals with pre-existing pulmonary or cardiac disease are the most susceptible to PM2.5 pollution. Complications that can arise from exposure to PM2.5 include decreased lung function, chronic bronchitis; respiratory symptoms such as asthma attacks and difficulty breathing, nonfatal heart attacks, irregular heartbeat, and premature death in individuals with pulmonary or cardiac disease.
2.2 Philadelphia-Wilmington, PA-NJ-DE Nonattainment Area Designation
On July 18, 1997, EPA established a health-based PM2.5 NAAQS at 15.0 micrograms per cubic meter (??g/m3) based on a 3-year average of annual mean PM2.5 concentrations (??????the annual PM2.5 NAAQS?????? or ??????the annual standard??????) (62 FR 36852). At that time, EPA also established a 24-hour standard of 65 ??g/m3 (??????1997 24-hour standard??????). See, 40 CFR 50.7. EPA established these standards based on significant evidence and numerous health studies demonstrating that serious health effects are associated with exposures to PM2.5. In 1999, EPA and State Air Quality Agencies initiated the monitoring process for the 1997 PM2.5 NAAQS and by January 2001, established a complete set of air quality monitors.
Following promulgation of a new or revised NAAQS, EPA is required by the CAA to designate areas throughout the United States as attaining or not attaining the NAAQS; this designation process is described in section 107(d)(1) of the CAA. On January 5, 2005, EPA published its air quality designations for the 1997 PM2.5 NAAQS based upon air quality monitoring data for calendar years 2001???2003 (70 FR 944). These designations became effective on April 5, 2005. The Philadelphia Area, which includes New Castle County in Delaware; Burlington, Camden, and Gloucester Counties in New Jersey; and Bucks, Chester, Delaware, Montgomery, and Philadelphia Counties in Pennsylvania (see Figure 2-1), was designated nonattainment for the 1997 annual PM2.5 NAAQS during this designations process (40 CFR 81.308, 81.832, and 81.339). The attainment date for the 1997 annual PM2.5 NAAQS is as expeditiously as practicable, but no more than five years from the date of designation. See, 40 CFR 51.1004(a)). Therefore, the attainment date for the Philadelphia Area was April 5, 2010.
On October 17, 2006 (71 FR 61144), EPA retained the 1997 annual PM2.5 NAAQS at 15 ??g/m3 based on a 3-year average of annual mean PM2.5 concentrations, and promulgated a 24-hour standard of 35 ??g/m3 based on a 3-year average of the 98th percentile of 24-hour concentrations (the ??????2006 24-hour standard??????). On November 13, 2009, EPA published the area designations for the 2006 24-hour standard (74 FR 58688). That action, effective on December 14, 2009, designated the same Philadelphia Area as nonattainment for the 2006 24-hour standard and clarified that the Philadelphia Area is designated as unclassifiable/attainment for the 1997 24-hour PM2.5 standard. This redesignation request addresses the 1997 annual PM2.5 standard. The 2006 24-hour PM2.5 standard will be addressed in a separate document.
In response to legal challenges of the 2006 annual standard, the U.S. Court of Appeals for the District of Columbia Circuit (D.C. Circuit) remanded this standard to EPA for further consideration. See, American Farm Bureau Federation and National Pork Producers Council, et al. v. EPA, 559 F.3d 512, (D.C. Circuit 2009). However, given that the 1997 and 2006 annual PM2.5 standards are identical, attainment of the 1997 annual standard would also indicate attainment of the remanded 2006 annual standard.
Figure 2???1 Philadelphia PM2.5 Nonattainment Area Boundaries 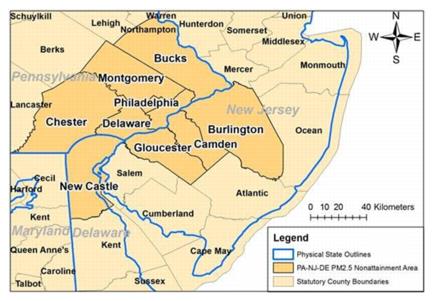
3 EPA Requirements for Redesignation
Section 107(d)(3)(E) of the CAA allows states to request nonattainment areas to be redesignated to attainment provided certain criteria are met. The criteria for redesignating a nonattainment area to attainment are as follows:
This document addresses each of these requirements. EPA has published applicable guidance in a memorandum from John Calcagni, Director, Air Quality Management Division, entitled Procedures for Processing Requests to Redesignate Areas to Attainment (redesignation guidance), issued September 4, 1992, to Regional Air Directors. 40 CFR Part 51, Subpart Z, entitled Provisions for Implementation of PM2.5 National Ambient Air Quality Standards (implementation rule) provides additional information. The State of Delaware has based this redesignation request and maintenance plan on the redesignation guidance and the implementation rule, supplemented with additional guidance received through coordination with EPA Region 3 staff.
3.1 NAAQS Compliance
3.1.1 EPA Requirements
CAA Section 107(d)(3)(E)(i) addresses attaining the standard. This demonstration should rely upon ambient air quality data. The data that are used to demonstrate attainment should be the product of ambient monitoring that is representative of the area of highest concentration. Additionally, the data should be collected and quality-assured in accordance with 40 CFR Part 58 and recorded in the Air Quality System (AQS) in order for it to be available to the public for review.
3.1.2 Delaware Approach
EPA???s published guidance document, ???Procedures for Processing Requests to Redesignate Areas to Attainment??? (September 4, 1992), which details specific requirements regarding the collection and use of ambient air monitoring data needed to support a redesignation request. Before the Philadelphia NAA can be redesignated to attainment for the 1997 annual NAAQS, the City of Philadelphia, Delaware Department of Natural Resources and Environmental Control (DNREC), Division of Air Quality (DAQ), the New Jersey Department of Environmental Protection and the Pennsylvania Department of Environmental Quality must each demonstrate that the annual PM2.5 NAAQS has been attained in their respective jurisdictions of the Philadelphia NAA. PM2.5 monitoring data must show that violations of the NAAQS are no longer occurring within the NAA.
This showing must rely on three complete, consecutive calendar years of quality assured data. Further, the air monitoring data must be quality assured in accordance with 40 CFR 58.10, recorded in EPA???s Air Quality System (AQS) database, and made available to the public. Finally, Delaware DAQ must commit to continue to operate an appropriate monitoring network to verify the maintenance of the attainment status, once the area has been redesignated to attainment. Taken together, there are three primary requirements:
1. A demonstration that the NAAQS for annual PM2.5, as published in 40 CFR 50.13, has been attained.
2. Ambient monitoring data quality assured in accordance with 40 CFR 58.10, recorded in the EPA air quality system (AQS) database, and available for public view.
3. A commitment that once redesignated, the state will continue to operate an appropriate monitoring network to verify the maintenance of the attainment status.
3.2 Demonstration that the NAAQS for annual PM2.5, as published in 40 CFR 50.7, has been attained (requirement 1 of 3)
The States of Delaware and New Jersey, and the Commonwealth of Pennsylvania, and the City of Philadelphia (??????the States??????), submitted complete quality assured air quality monitoring data into the EPA Air Quality System (AQS) database for the 2007???2011 monitoring periods. The States then certified that data. DAQ has also obtained preliminary 2012 monitoring data. The criteria for determining if an area is attaining the 1997 annual PM2.5 NAAQS are set out in 40 CFR 50.13 and Appendix N of 40 CFR 50. The annual PM2.5 NAAQS is met when the annual design value (dv) is less than or equal to 15.0 micrograms per cubic meter (??g/m3). Three years of valid annual means are required to produce a valid annual standard design value. A year meets data completeness requirements when at least 75 percent of the scheduled sampling days for each quarter have valid data. The use of less than complete data is subject to the approval of EPA, which may consider factors such as monitoring site closures/moves, monitoring diligence, and nearby concentrations in determining whether to use such data.
While most of the monitoring data submitted by the States was complete, several monitors in the Philadelphia NAA had less than four quarters of complete data for one or more years during the 2007???2009, 2008???2010 and 2009-2011 monitoring periods. For these monitors, EPA applied the data substitution test set out in the April 1999 EPA guidance document ??????Guideline on Data Handling Conventions for the PM NAAQS.??? The ??????maximum quarter?????? substitution test (Max-Q) identified in the guidance document is used for monitors with missing data. Maximum recorded values are substituted for the missing data. The resulting design value is compared to the standard. The monitor passes if the design value with maximum values substituted meets the standard. If the monitor does not pass using the Max-Q Sub test, then another statistical method was required. The statistical method used to determine whether an incomplete monitor would have met the NAAQS, is to first establish a linear regression relationship between the target monitor and another monitor in or close to the nonattainment area. The linear regression would then be used to fill in the missing data for the target monitor. The results are checked with an additional statistical procedure (???bootstrapping???), to give a ???diagnostic??? design value verifying if the conclusion of attainment is correct.
2007-2009 and 2008-2010 monitoring data
Considering 2007???2009 data, six monitors had less than complete data, with five of those monitors passing the Max-Q Sub test. However, the New Garden, PA monitor???s missing data could not be evaluated using the Max-Q test. Therefore, EPA performed a linear regression analysis and bootstrapping to show that the New Garden monitor also met the 1997 annual NAAQS. In summary, all Philadelphia NAA monitors meet the 1997 annual NAAQS for the 2007-2009 and 2008-2010 monitoring periods. More details of EPA???s analysis can be found in the EPA Technical Support Documents (TSD).3,4
2009-2011 monitoring data
Considering 2009???2011 data, three monitors had less than complete data (New Garden, PA, and Bellefonte and Newark in Delaware - monitor IDs 420290100, 100031003 and 100031012). However, based on email correspondence with EPA Region 3, all of the 2009-2011 monitoring data passed the max-Q substitution test, and the 2009-2011 monitoring values as received from EPA are included in the air quality tables within this plan (see table 3-1).5 Furthermore, according to the PM2.5 implementation rule, the attainment date for the Philadelphia Area is April 5, 2010, and monitoring data from the period 2007???2009 is used to determine if the area attained by April 5, 2010.
Table 3-1 shows the PM2.5 2007-2011 quality assured and certified annual means for each monitor in the Philadelphia NAA for the years 2007???2011. Table 3-2 shows the 3-year design values for the 2007-2009, 2008-2010, and 2009-2011. The highest 3-year design values based on 2007-2009, 2008-2010, and 2009-2011 data are 13.9 ??g/m3, 13.8 ??g/m3 and 13.7 ??g/m3, all of which are less than the level of the annual PM2.5 NAAQS of 15.0 ??g/m3. Based on preliminary 2012 data from AQS, the 1st quarter values also continue to show attainment based on the highest value of 14.6 ??g/m3 in Philadelphia, (monitor ID 421010004).
Therefore, complete quality-assured and certified ambient air quality monitoring data demonstrate that the air quality has met the 1997 NAAQS for annual PM2.5 in the Philadelphia NAA. The NAAQS attainment, accompanied by decreases in emission levels discussed in Section 7, supports a redesignation to attainment for the New Castle County, Delaware portion of the Philadelphia NAA based on the requirements in Section 107(d)(3)(E) of the CAA as amended.
Table 3-1 2007-2012 Annual Means (ug/m3)
09-11 Completeness (5) | |||||||||||
State | County | Monitor ID | 2007 | 2008 | 2009 | 2010 | 2011 | Status (3) | Data Substitution (4) | Pre-Lim. 2012 | |
DE | Bellefonte | 100031003 | 13.4 | 13.0 | 10.2 | 10.2 | 9.4 | C | Max-Q | 8.5 | |
Lums | 100031007 | 12.5 | 11.5 | 10.0 | 10.0 | 8.8 | C | Max-Q | 8.0 | ||
Newark | 100031012 | 13.4 | 12.5 | 10.6 | 10.4 | 10.4 | C | Max-Q | 8.8 | ||
MLK | 100032004 | 14.4 | 13.5 | 11.2 | 10.6 | 10.3 | C | 9.7 | |||
NJ | Camden | 340071007 | 13.8 | 11.9 | 9.5 | 9.5 | 10.1 | C | 8.6 | ||
Gloucester | 340150004 | 13.3 | 11.5 | 9.3 | 9.1 | 9.4 | C | Max-Q | 9.3 | ||
PA | Bucks | 420170012 | 13.0 | 12.7 | 10.8 | 10.5 | 11.5 | C | 10.6 | ||
Chester | 420290100 | 14.1 | 13.7 | 14.1 | 13.8 | 13.3 | C | Max-Q | 8.9 | ||
Delaware | 420450002 | 14.7 | 13.9 | 12.4 | 13.5 | 12.6 | C | 10.7 | |||
Montgomery | 420910013 | 13.1 | 11.7 | 10.4 | 9.5 | 10.3 | C | 8.6 | |||
Philadelphia | 421010004 | 13.7 | 13.0 | 10.8 | 10.7 | 13.2 | C | 14.6 | |||
Philadelphia | 421010024 (1) | 12.9 | 12.0 | 9.9 | 9.6 | - | Inc | - | |||
Philadelphia | 421010047 | 14.3 | 13.5 | 11.1 | 11.0 | 11.4 | C | 9.9 | |||
Philadelphia | 421010055 (6) | 13.5 | 11.3 | 11.3 | 11.4 | C | 9.8 | ||||
Philadelphia | 421010057 | 12.0 | 13.3 | 11.1 | 10.9 | 11.4 | C | 10.0 | |||
Philadelphia | 421011002 (2) | - | - | 9.0 | Inc | 13.4 | |||||
NAA Avg. (all monitors) | 13.5 | 12.7 | 10.8 | 10.7 | 10.8 | 10.8 | |||||
Notes:
Data Source:
1. Monitoring site was shutdown on January 1, 2011.
2. Monitoring site commenced operation on June 1, 2010. However, as of July 30, 2012, AQS 2010 data for this monitor was not available. (see footnote 5)
3. This column indicates whether the monitoring data from the monitor meet the completeness requirement (C) or not (Inc) for each quarter of the 3-year period.
4. This column identifies the data substitution technique utilized to deem 'complete' the annual design value of the incomplete monitors. ???Max-Q??? denotes that the monitor passed the maximum quarter substitution test.
5. As determined by EPA (see footnote 5)
6. Monitor started operating 2008
2012 is Preliminary and not certified ??? only the 1st quarter was available from AQS (as of July 31, 2012)
Table 3-2 Design Values: 2007-2009, 2008-2010 and 2009-2011
State | County | Monitor ID | 07-09 DV | US EPA Analysis (3) | 08-10 DV | US EPA Analysis (3) | 09-11 DV | US EPA Analysis (3) |
DE | Bellefonte | 100031003 | 12.2 | C | 11.1 | C | 9.9 | Max Q |
Lums | 100031007 | 11.3 | Max Q | 10.5 | C | 9.6 | Max Q | |
Newark | 100031012 | 12.2 | Max Q | 11.2 | Max Q | 10.5 | Max Q | |
MLK | 100032004 | 13.0 | Max Q | 11.7 | Max Q | 10.7 | C | |
NJ | Camden | 340071007 | 11.7 | C | 10.3 | C | 9.7 | C |
Gloucester | 340150004 | 11.4 | C | 10.0 | C | 9.3 | Max Q | |
PA | Bucks | 420170012 | 12.2 | C | 11.3 | C | 10.9 | C |
Chester | 420290100 | 13.9 | Bootstrap | 13.8 | Max Q | 13.7 | Max Q | |
Delaware | 420450002 | 13.7 | C | 13.3 | C | 12.7 | C | |
Montgomery | 420910013 | 11.7 | C | 10.5 | C | 10.1 | C | |
Philadelphia | 421010004 | 12.5 | C | 11.5 | C | 11.6 | C | |
Philadelphia | 421010024 | 11.6 | Max Q | 10.5 | C | 9.8 | Inc (1) | |
Philadelphia | 421010047 | 13.0 | Max Q | 11.9 | C | 11.2 | C | |
Philadelphia | 421010055 | 12.4 | C | 12.0 | C | 11.4 | C | |
Philadelphia | 421010057 | 12.1 | C | 11.7 | C | 11.1 | C | |
Philadelphia | 421011002 | - | - | - | 9 | Inc (2) | ||
Philadelphia NAA Average ??g/m3 (all monitors) | 12.3 | 11.4 | 10.8 | |||||
Notes:
Sources of data:
1. Monitoring site was shutdown on January 1, 2011.
2. Monitoring site commenced operation on June 1, 2010.
3. This column indicates whether the monitoring data from the monitor meet the completeness requirement (C) or not (Inc.) for each quarter of the 3-year period. This also column identifies the data substitution technique utilized to deem 'complete' the annual design value of the incomplete monitors. ???Max Q Sub??? denotes that the monitor passed the maximum quarter substitution test. (EPA, footnote 5)
3.3 Ambient monitoring data quality assured in accordance with 40 CFR 58.10, recorded in the EPA air quality system (AQS) database, and available for public view (Requirement 2 of 3)
Delaware DAQ has quality assured all data in accordance with 40 CFR 58.10 and all other federal requirements. Delaware DAQ has recorded the data in the AQS database and, therefore, the data are available to the public.
Delaware began official PM2.5 monitoring in 1999. Delaware???s PM2.5 network consists of seven (7) monitoring sites, one of which employs a collocated monitor. There are four (4) sites in New Castle County, two (2) in Kent County and one (1) in Sussex County. Table 3-3 lists the PM2.5 sites in New Castle County (the only nonattainment county), including the nature of the area, and general site descriptions. Table 3-4 contains more specific information for each PM2.5 monitoring site in New Castle County.
Table 3-3 PM2.5 Monitoring Site General Information
Site Name & AQS ID | Land Use | Setting | Metropolitan Statistical Area |
Bellefonte 10-003-1003 | Residential | Suburban | Philadelphia - Wilmington |
MLK 10-003-2004 | Commercial | Urban | Philadelphia - Wilmington |
Newark 10-003-1012 | Residential | Suburban | Philadelphia - Wilmington |
Lums Pond 10-003-1007 | Agricultural | Rural | Philadelphia - Wilmington |
Table 3-4 PM2.5 Monitor Site Specific Information
Site Name & AQS ID | Parameter | Start Date | Objective |
Bellefonte 10-003-1003 | PM2.5 | 1/1/1999 | Population Exposure, Attainment Status |
MLK 10-003-2004 | PM2.5 | 1/1/1999 | Maximum concentration, Attainment Status |
PM2.5 speciation | 6/1/2001 | PM2.5 Characterization | |
Black Carbon | 1/1/2001 | Diesel PM2.5 Indicator | |
Newark 10-003-1012 | PM2.5 | 12/15/1999 | Population Exposure, Attainment Status |
Lums Pond 10-003-1007 | PM2.5 | 1/1/1999 | Transport/Background, Attainment Status |
The primary goal of the PM2.5 monitoring network in Delaware is to determine the status of the ambient air with respect to the 24-hour and annual average PM2.5 NAAQS. In accordance with federal regulations, state agencies must operate at least the minimum number of required PM2.5 sites listed in 40 CFR Part 58 Appendix D Table D-5. These required monitoring stations or sites must be sited to represent community-wide air quality. In addition, the following specific criteria also apply:
(1) At least one monitoring station is to be sited in a population-oriented area of expected maximum concentration.
(2) For areas with more than one required station, a monitoring station is to be sited in an area of poor air quality.
(3) Each State shall install and operate at least one PM2.5 site to monitor for regional background and at least one PM2.5 site to monitor regional transport.
Figure 3-1 shows the locations of Delaware???s PM2.5 monitors. All data from these monitors are measured using EPA approved federal reference methods (FRM). All PM2.5 monitoring sites are located appropriately and are eligible for comparison to the annual and daily PM2.5 NAAQS.
The standard monitoring schedule is one in three days, with one site (MLK-Wilmington) monitoring every day. MLK is also the designated collocated site, with the collocated monitor designated as MLK-b operating on a one in six day schedule. All data submitted to EPA???s Air Quality System (AQS) in a timely manner in accordance to the schedule prescribed by EPA.
Chemical speciation is encouraged at sites where the chemically resolved data would be useful in developing SIPs and supporting atmospheric or health effects related studies. Chemical speciation is conducted at MLK in Wilmington and Dover in Kent County. The PM2.5 chemical speciation sites include analysis for elements, selected anions and cations, and carbon.
Figure 3-1 Delaware???s PM2.5 Monitoring Site Locations
Delaware???s original PM2.5 monitoring network design and monitor siting were completed in accordance with EPA requirements and guidance as stated in 40 CFR Part 58 Appendices D and E, and the EPA Office of Air Quality Planning & Standards (OAQPS) document ???Guidance for Network Design and Optimum Site Exposure for PM2.5 and PM10??? (EPA 1997a). Final network documents were submitted to EPA Region 3 in June 1998, and EPA approved Delaware???s PM2.5 monitoring network.
Delaware Annual Ambient Air Monitoring Network Reviews, including PM2.5, have been completed each year in accordance with 40 CFR Part 58 Appendix D and subsequently submitted to EPA Region 3 for approval.
In fulfillment of the federal 103 grant requirements, Delaware submits annual Delaware Data Quality Assessments for PM2.5 speciation data and PM2.5 FRM data to EPA Region 3. All data complies with appropriate federal and state requirements, including 40 CFR Part 50 Appendices L and N, and 40 CFR Part 58 Appendix A.
In fulfillment of the federal 103 grant requirements, Delaware also submits annual PM2.5 Speciation Monitoring Network Review and Monitoring Strategy reports to EPA Region 3. The PM2.5 speciation network design and monitor siting follows EPA requirements and guidance as stated in 40 CFR Part 58 Appendices D and E, and the documents ???Guidance for Network Design and Optimum Site Exposure for PM2.5 and PM10" (EPA 1997a), ???Particulate Matter (PM2.5) Speciation Guidance??? (EPA 1999), and ???Guideline on Speciated Particulate Monitoring??? (EPA 1999a).
3.4 A commitment that, once redesignated, the state will continue to operate an appropriate monitoring network to verify the maintenance of the attainment status (requirement 3 of 3).
3.4.1 EPA Requirements
Once an area has been redesignated, the states must continue to operate an appropriate air quality monitoring network in accordance with 40 CFR Part 58, to verify the area's attainment status. In cases where measured mobile source parameters (for example, vehicle miles traveled) have changed over time, the state may also need to perform a saturation monitoring study to determine the need for and location of additional permanent monitors.
3.4.2 Delaware Approach
The State of Delaware operates a monitoring network that is significantly more robust than required by federal regulation. New Castle County is nonattainment for the 1997 PM2.5 annual standard and the 2006 daily PM2.5 standard. Accordingly, Delaware is required to maintain its current monitoring network.
As mentioned above, states must continue to operate an appropriate air quality monitoring network in accordance with 40 CFR Part 58, to verify the area's attainment status.
Information on Delaware???s monitoring network was discussed in Section 3.3.
The State of Delaware commits to operating and maintaining an air quality network for PM2.5 monitoring that meets all federal requirements. However, should changes become necessary in the future Delaware DAQ will consult with EPA Region 3 prior to making changes to the existing monitoring network. Delaware DAQ will continue to quality assure the monitoring data to meet the requirements of 40 CFR 58 and all other federal requirements. Delaware DAQ will enter all data into AQS on a timely basis in accordance with federal guidelines.
4 Permanent and Enforceable Emission Reductions
4.1 EPA Requirements
As required by Section 107(d)(3)(E)(iii) and in EPA redesignation guidance, states must be able to reasonably attribute its air quality improvements to emission reductions of precursors or direct PM2.5 that are permanent and enforceable. Attainment resulting from temporary reductions in emission rates (such as reduced production or shutdown due to temporary adverse economic conditions) or unusually favorable meteorological conditions does not qualify.
4.2 Delaware Approach
Delaware demonstrates the improvement in air quality described in 3.2 of this document was not a result of temporary adverse economic conditions (4.2.1) or unusually favorable meteorology (4.2.2). Delaware then demonstrates that the improvements in air quality described in 3.2 of this document are reasonably attributable to permanent and enforceable emission reductions of direct PM2.5 and PM2.5 precursors (4.2.3 and 4.3).
4.2.1 Economic Conditions
Delaware evaluated the role economic conditions may have played in the improvement in air quality described in 3.2 of this document by evaluating the Gross Domestic Product (GDP) growth rate. The GDP growth rate is an indicator of economic health. If the GDP growth rate is increasing, it is an indication that the activity of emitting sources are increasing. Conversely, if the GDP is declining it is an indication that the activity of emitting sources may be reduced because of economic conditions.
Delaware specific GDP for all industries, obtained from the U.S. Bureau of Economic Analysis (BEA), is presented in Figure 4-1.
Figure 4-1 2002 ??? 2011 Delaware Gross Domestic Product ??? All Industry
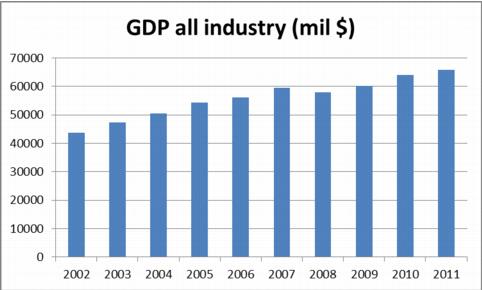
Figure 4-1 shows that except for a decline between 2007 and 20086, all industries increased GDP in every year from 2002 through 2011. Of specific relevance to air quality is the comparison between the time when Delaware???s air quality did not meet the PM2.5 standard (i.e., 2002-2006) and the time when it did (i.e., 2007-2011). The GDP in every year between 2007 and 2011 is greater than every year between 2002 and 2006. This analysis of GDP indicates that economic conditions did not contribute to the improvement in air quality.
4.2.2 Meteorology
Delaware evaluated the role meteorology may have played in the improvement in air quality described in 3.2 of this document by evaluating temperature and precipitation data. Temperature and precipitation are the primary meteorological variables that impact the formation of PM2.5. Temperature and precipitation impact both the emission from sources (e.g., power plant emissions are highest during very hot and cold weather), and ambient PM2.5 concentrations (e.g., precipitation removes PM2.5 from the air through deposition).
Delaware analyzed historical meteorological data for Wilmington, Delaware, which is the location where Delaware???s highest PM2.5 concentrations are recorded (monitor ID = 100032004). Table 4-1 shows 3-year monthly averages for: minimum, maximum and means temperatures (in degrees Fahrenheit), as well as total precipitation by monthly average and for the entire 3-year periods 2001-2003 and 2007-2009.7
Table 4-1 Monthly Average Min, Max and Mean Temperatures and Precipitation, including Total Precipitation
2001-2003 | 2007-2009 | 2001-2003 | 2007-2009 | 2001-2003 | 2007-2009 | 2001-2003 | 2007-2009 | |
Month | 3-yr AVG Min. Temp. (o F) | 3-yr AVG Min. Temp. (o F) | 3-yr AVG Max. Temp. (o F) | 3-yr AVG Max. Temp. (o F) | 3-yr Mean Temp. (o F) | 3-yr Mean Temp. (o F) | Total Precip. (in) | Total Precip. (in) |
Jan | 25.2 | 26.5 | 40.1 | 41.8 | 32.7 | 34.2 | 7.6 | 8.0 |
Feb | 26.3 | 25.1 | 43.2 | 42.5 | 34.8 | 33.8 | 8.5 | 6.6 |
Mar | 33.1 | 33.6 | 51.5 | 53.3 | 42.2 | 43.5 | 14.4 | 10.5 |
Apr | 43.0 | 43.4 | 63.6 | 63.1 | 53.3 | 53.3 | 6.3 | 14.6 |
May | 51.2 | 52.1 | 70.2 | 73.5 | 60.7 | 62.8 | 12.7 | 10.0 |
Jun | 62.1 | 63.5 | 80.3 | 82.3 | 71.2 | 72.9 | 19.1 | 12.1 |
Jul | 66.0 | 66.1 | 84.6 | 86.0 | 75.2 | 76.1 | 6.6 | 11.8 |
Aug | 68.1 | 66.2 | 86.3 | 84.6 | 77.2 | 75.4 | 8.9 | 11.3 |
Sep | 58.2 | 59.3 | 77.4 | 78.5 | 67.8 | 68.9 | 13.4 | 10.6 |
Oct | 45.6 | 48.3 | 65.3 | 68.0 | 55.4 | 58.1 | 11.3 | 13.6 |
Nov | 38.2 | 38.7 | 57.6 | 54.9 | 47.9 | 46.8 | 8.8 | 7.5 |
Dec | 29.6 | 29.6 | 45.4 | 44.5 | 37.5 | 37.0 | 11.4 | 17.8 |
Annual average 3-Yr Average Temp., and 3-Yr Total Precipitation | 45.5 | 46.0 | 63.8 | 64.4 | 54.7 | 55.2 | 129 | 134.3 |
From Table 4-1, we see that the annual average 3-year monthly averages for minimum, maximum, and mean temperatures for 2007-2009 are slightly higher than those temperatures during the years 2001-2003 (e.g., the 2001-2003 annual average mean temperature was 54.7 degrees while the 2007-2009 annual average mean temperature was 55.2 degrees). Higher temperatures typically correlate with higher ambient PM2.5 concentrations, which indicate temperature is a factor that negatively impacted air quality.
From Table 4-1, we see that 3-year total precipitation was about 4.3% higher in 2007-2009 compared to 2001-2003 (134.8 in. and 129 in. respectively). Increased precipitation disfavors PM2.5 formation, because it results in deposition of existing ambient PM2.5 and precursors. Because total precipitation was only slightly higher during the years showing attainment (2007-2009), increased precipitation did not likely contribute to the improved air quality.
In summary, 1) the annual average 3-year monthly min, max, and mean temperatures are very similar between the nonattainment timeframe (2001-2003) and the attainment timeframe (2007-2009), and 2) the total precipitation is also very similar between those two periods. Therefore, although Meteorology will always play a role in the formation of PM2.5, DAQ concludes that meteorology did not play a significant role in air quality improvements for redesignation purposes under the 1997 annual PM2.5 NAAQS.
4.2.3 Emission Inventory Improvements from 2002 to 2007
It was demonstrated in 4.2.1 and 4.2.2 that neither economic conditions nor meteorology significantly contributed to the improved air quality. Given this, it follows that permanent and enforceable reductions of PM2.5, NOX and SO2,8 from a variety of state and federal measures are the primary reason for the improved air quality and attainment of the standard for fine particles.
As discussed previously, EPA published its air quality designations for the 1997 PM2.5 NAAQS based upon air quality monitoring data for calendar years 2001???2003 (70 FR 944). Since 2001, permanent and enforceable reductions of primary PM2.5 and secondary PM2.5 precursor emissions have contributed to improvements in PM2.5 air quality and to the attainment of the PM2.5 NAAQS. To help demonstrate how emission reductions have improved air quality, we evaluate air quality trends, which can be seen in Table 4-2 and Figures 4-2 and 4-3, and discuss emission reductions due to permanent and enforceable control measures.
The values in Table 4-2 and Figure 4-2 represent the annual average concentration as calculated from the four calendar quarterly averages at each monitoring site. As Table 4-2 shows, the highest annual value in the Philadelphia NAA nonattainment area has decreased from 17.6 ??g/m3 in 2001 (monitor ID 100032004) to 13.3 ??g/m3 in 2011, or 4.3 ??g/m3, which represents a 24% drop. The annual average is the basic statistic used in determining trends and compliance with the annual average NAAQS.
Table 4-2 Philadelphia NAA annual averages - 2001-2011
State | Monitor ID | County | 2001 | 2002 | 2003 | 2004 | 2005 | 2006 | 2007 | 2008 | 2009 | 2010 | 2011 |
DE | 100031003 | Bellefonte | 15.6 | 14.0 | 14.8 | 13.9 | 14.3 | 12.3 | 13.4 | 13.0 | 10.2 | 10.2 | 9.4 |
100031007 | Lums | 14.5 | 13.0 | 13.3 | 13.2 | 13.8 | 11.4 | 12.5 | 11.5 | 10.0 | 10.0 | 8.8 | |
100031012 | Newark | 15.8 | 14.3 | 14.8 | 14.5 | 14.4 | 12.7 | 13.4 | 12.5 | 10.6 | 10.4 | 10.4 | |
100032004 | MLK | 17.6 | 14.8 | 15.5 | 14.9 | 15.0 | 14.7 | 14.4 | 13.5 | 11.2 | 10.6 | 10.3 | |
NJ | 340071007 | Camden | 14.2 | 13.9 | 13.9 | 13.2 | 14.3 | 12.4 | 13.8 | 11.9 | 9.5 | 9.5 | 10.1 |
340150004 | Gloucester | 14.5 | 12.3 | 13.8 | 12.4 | 14.2 | 9.3 | 13.3 | 11.5 | 9.3 | 9.1 | 9.4 | |
PA | 420170012 | Bucks | 14.5 | 14.2 | 14.4 | 13.0 | 14.3 | 12.2 | 13.0 | 12.7 | 10.8 | 10.5 | 11.5 |
420290100 | Chester | ND | ND | 15.6 | 14.3 | 15.9 | 12.6 | 14.1 | 13.7 | 14.1 | 13.8 | 13.3 | |
420450002 | Delaware | 15.9 | 14.7 | 15.3 | 15.0 | 16.9 | 14.2 | 14.7 | 13.9 | 12.4 | 13.5 | 12.6 | |
420910013 | Montgomery | 14.9 | 13.6 | 13.9 | 12.0 | 12.5 | 12.1 | 13.1 | 11.7 | 10.4 | 9.5 | 10.3 | |
421010004 | Philadelphia | 16.5 | 14.4 | 14.8 | 13.9 | 14.2 | 13.5 | 13.7 | 13.0 | 10.8 | 10.7 | 13.2 | |
421010024 | Philadelphia | 14.6 | 13.7 | 13.2 | 12.8 | 12.9 | 12.4 | 12.9 | 12.0 | 9.9 | 9.6 | - | |
421010047 | Philadelphia | 17.0 | 15.6 | 16.1 | 14.4 | 15.1 | 15.4 | 14.3 | 13.5 | 11.1 | 11.0 | 11.4 | |
421010055 | Philadelphia | ND | ND | ND | ND | ND | ND | ND | 13.5 | 11.3 | 11.3 | 11.4 | |
421010057 | Philadelphia | ND | ND | ND | ND | ND | ND | 12.0 | 13.3 | 11.1 | 10.9 | 11.4 | |
421011002 | Philadelphia | ND | ND | ND | ND | ND | ND | ND | ND | ND | ND | 9.0 | |
NAA Average - all monitors | 15.5 | 14.0 | 14.6 | 13.7 | 14.4 | 12.7 | 13.5 | 12.7 | 10.8 | 10.7 | 10.8 | ||
Figure 4.2 Philadelphia NAA ??? 2001 to 2011 annual PM2.5 trends
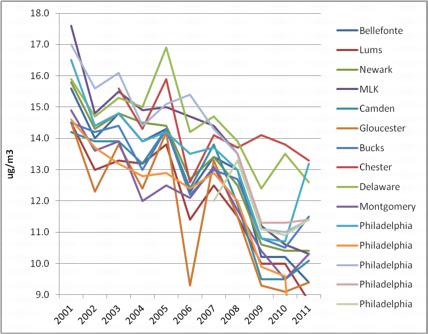
Figure 4-3 also shows 2001-2011 monitoring data, but instead of showing each monitor trend, all the monitors in the Philadelphia NAA were averaged together, by year to give a ???summary-view.???
Figure 4.3 Philadelphia NAA ??? yearly PM2.5 trends (avg. all monitors)
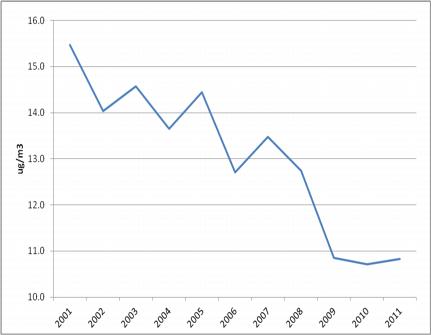
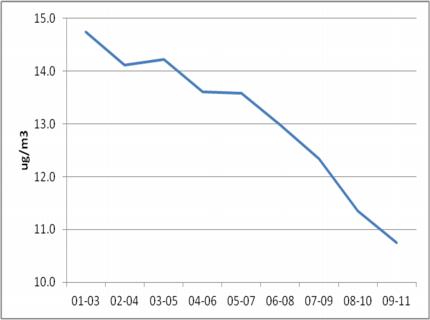
Figure 4-4 shows the downward trends since 2001 using 3-year rolling-averages (i.e., design values).
Figure 4.4 Philadelphia NAA ??? 2003 to 2011 PM2.5 3-Year Rolling Averages
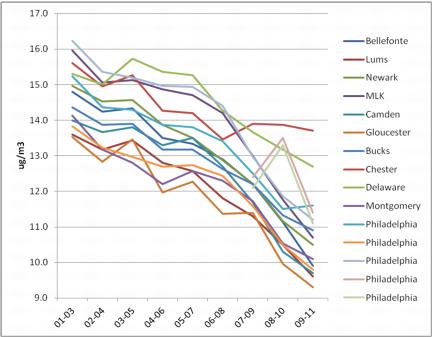
Figure 4-5 is a variation on Figure 4-4 and plots the average design values per year, calculated from all monitors in the Philadelphia NAA.
Figure 4.5 Philadelphia NAA ??? Average of Design Values (all monitors)
Some of these air quality improvements were a result of emissions reductions which were due to the application of tighter federal emission standards on motor vehicles and fuels, and some due to the requirements of the federal NOx SIP Call. Others were due to Delaware-specific control measures. Section 4.3 of this plan describes these reductions in more detail, along with an explanation of their regulatory status.
One of the ways states have demonstrated how controls have contributed to reductions is by comparing a base year emission inventory to the attainment year emission inventory. The EPA???s PM2.5 Emissions Inventory Guidance required that states with PM2.5 NAAQS nonattainment areas prepare and submit a 2002 base year inventory of anthropogenic sources of direct PM2.5 and precursors of secondary PM2.5 emissions, namely NOx and SO2. The 2002 base year inventory included emissions from point, non-point, on-road mobile and non-road mobile emissions. The 2002 base year was used in Delaware???s Annual PM2.5 Attainment Demonstration SIP (submitted to EPA in April, 2008). It was picked as the base year for this annual redesignation request because it reflects one of the years in which Delaware was designated nonattainment (e.g., 2001-2003).
The Philadelphia NAA came into attainment for the 1997 annual PM2.5 NAAQS based on 2007-2009 monitoring data. Delaware chose to use 2007 as the attainment year (e.g., one of the three years during which the area attained the standard), from which future inventories are projected in the accompanying maintenance plan.
The 2007 inventory was developed through the MARAMA regional planning process.
Documentation of how the 2007 attainment year was developed can be found in Technical Support Document for the Development of the 2007 Emission Inventory for Regional Air Quality Modeling in the Northeast / Mid-Atlantic Region Version 3.3. January 23, 2012. The MARAMA 2007 TSD includes annual emissions for carbon monoxide (CO), ammonia (NH3), oxides of nitrogen (NOx), particulate matter (PM), sulfur dioxide (SO2), and volatile organic compounds (VOC). The PM species in the inventory are categorized as: filterable and condensable particles with an aerodynamic diameter less than or equal to a nominal 10 and 2.5 micrometers (i.e., PM10-PRI and PM25-PRI); filterable particles with an aerodynamic diameter less than or equal to a nominal 10 and 2.5 micrometers (i.e., PM10-FIL and PM25-FIL); and condensable particles (PM-CON). Note that PM10-PRI equals the sum of PM10-FIL and PM-CON, and PM25-PRI equals the sum of PM25-FIL and PM-CON.
However, for purposes of this plan, Delaware only provides NOx, PM2.5 and SO2, because as Delaware determined in its 2008 PM2.5 Attainment Demonstration, only those pollutants are regulated as PM2.5 and PM2.5 precursors.
Table 4-3 summarizes 20029 and 2007 emissions by major source category and by pollutant for New Castle County, as well as the change in terms of tons per year (tpy) and percent decrease/increase.10
Table 4-3 New Castle County 2002-2007 Emission Changes
Source Sector | NOx | PM2.5 | SO2 | |||||||||
2002 | 2007 | ?? (tpy) | ?? (%) | 2002 | 2007 | ?? (tpy) | ?? (%) | 2002 | 2007 | ?? (tpy) | ?? (%) | |
Point | 9,157 | 6,635 | 2,522 | 28% | 1,733 | 1,335 | 398 | 23% | 47,070 | 13,380 | 33,690 | 72% |
Non-point | 1,513 | 1,293 | 220 | 15% | 1,073 | 1,207 | -134 | -12% | 780 | 630 | 150 | 19% |
On-road | 11,799 | 10,577 | 1,222 | 10% | 209 | 324 | -115 | -55% | 326 | 100 | 226 | 69% |
Non-road | 8,279 | 4,580 | 3,699 | 45% | 415 | 327 | 88 | 21% | 2,061 | 1,118 | 943 | 46% |
All Sectors | 30,748 | 23,084 | 7,664 | 25% | 3,430 | 3,193 | 237 | 7% | 50,237 | 15,228 | 35,009 | 70% |
By comparing the 2002 and 2007 inventories, we see that total direct PM2.5 emissions were reduced by 237 tons per year, and that NOx emissions decreased by 7,664 tons per year. These reductions were primarily from point and non-road mobile sources. SO2 emissions decreased much more significantly - by 35,009 tons per year - largely due to reductions from the Delaware City Refinery controls put into effect in 2006 as a result of a Federal Consent decree. These sizeable emissions reductions, as well as corresponding reductions in upwind areas and other nearby states, resulted in a substantial improvement in PM2.5 air quality in the Philadelphia NAA, ultimately resulting in attainment of the 1997 PM2.5 NAAQS.
4.3 Enforceable and Permanent PM2.5, NOx and SO2 Measures that Contributed to Improved Air Quality after 2002 and through 2007
4.3.1 Delaware-specific Control Measures
4.3.2 Federal Control Measures
Area sources
EPA???s New Source Performance Standards for Woodstoves (NSPS). These standards are codified at 40 CFR Part 60, subpart AAA. The final standards were promulgated in 1988 (53 FR 5860). The rule requires manufacturers of new residential wood heaters (e.g., wood stoves) to design heaters to meet particulate emission (PM) limits, have representative model lines tested by EPA-accredited labs, and attach EPA labels and hangtags after EPA approval. For the general woodstoves and fireplaces category (SCC 2104008000) USEPA computed a weighted average distribution based on 19.4% fireplaces, 71.6% old woodstoves, 9.1% new woodstoves using 2002 Platform emissions for PM2.5. These fractions are based on the fraction of emissions from these processes in the states that did not have the ???general woodstoves and fireplaces??? SCC in the 2002 NEI.
Control Programs Included in the NMIM/NONROAD Model
Under 40 CFR Part 89, EPA adopted standards for emissions of NOX, hydrocarbons (HC), and carbon monoxide (CO) from several groups of nonroad engines, including industrial spark-ignition engines and recreational nonroad vehicles. Industrial spark-ignition engines power commercial and industrial applications and include forklifts, electric generators, airport baggage transport vehicles, and a variety of farm and construction applications. Nonroad recreational vehicles include snowmobiles, off-highway motorcycles, and all-terrain vehicles. These rules were initially effective in 2004 and will be fully phased in by 2012.
Control of Air Pollution; Determination of Significance for Nonroad Sources and Emission Standards for New Nonroad Compression Ignition Engines at or Above 37 Kilowatts
59 FR 31036, June 17, 1994. This rule establishes Tier 1 exhaust emission standards for HC, NOx, CO, and PM for nonroad compression-ignition (CI) engines ???37kW (???50hp). Marine engines are not included in this rule. The start dates and pollutants affected vary by hp category as follows:
Emissions for New Nonroad Spark-Ignition Engines At or Below 19 Kilowatts; Final Rule 60 FR 34581. July 3, 1995. This rule establishes Phase 1 exhaust emission standards for HC, NOx, and CO for nonroad spark-ignition engines ???19kW (???25hp). This rule includes both handheld (HH) and non-handheld (NHH) engines. The Phase 1 standards became effective in 1997 for:
The Phase 1 standards became effective in 1998 for: Class V HH engines (???50cc)
Final Rule for New Gasoline Spark-Ignition Marine Engines; Exemptions for New Nonroad Compression-Ignition Engines at or Above 37 Kilowatts and New Nonroad Spark-Ignition Engines at or Below 19 Kilowatts 61 FR 52088. October 4, 1996. This rule establishes exhaust emission standards for HC+NOx for personal watercraft and outboard (PWC/OB) marine SI engines. The standards were phased in from 1998-2006.
Control of Emissions of Air Pollution from Nonroad Diesel Engines 63 FR 56967 October 23, 1998. This final rule sets Tier 1 standards for engines under 50 hp, phasing in from 1999 to 2000. The rule also phases in more stringent Tier 2 standards for all engine sizes from 2001 to 2006, and even more stringent Tier 3 standards for engines rated over 50 hp from 2006 to 2008. The Tier 2 and Tier 3 standards apply to NMHC+NOx, CO, and PM. The start dates by hp category and tier are as follows:
This rule does not apply to marine diesel engines above 50 hp.
Phase 2: Emission Standards for New Nonroad Non-handheld Spark Ignition Engines At or Below 19 Kilowatts 64 FR 15207. March 30, 1999. This rule establishes Phase 2 exhaust emission standards for HC+NOx for nonroad non-handheld (NHH) spark-ignition engines ???19kW (???25hp). The Phase 2 standards for Class I NHH engines (<225cc) became effective on August 1, 2007 (or August 1, 2003 for any engine initially produced on or after that date). The Phase 2 standards for Class II NHH engines (???225cc) were phased in from 2001-2005.
Phase 2: Emission Standards for New Nonroad Spark-Ignition Handheld Engines At or Below 19 Kilowatts and Minor Amendments to Emission Requirements Applicable to Small Spark-Ignition Engines and Marine Spark-Ignition Engines; Final Rule 65 FR 24268 April 25, 2000. This rule establishes Phase 2 exhaust emission standards for HC+NOx for nonroad handheld (HH) spark-ignition engines ???19kW (???25hp). The Phase 2 standards were phased in from 2002-2005 for Class III and Class IV engines and were phased in from 2004-2007 for Class V engines.
Control of Emissions From Nonroad Large Spark-Ignition Engines and Recreational Engines (Marine and Land-Based); Final Rule 67 FR 68241. November 8, 2002. This rule establishes exhaust and evaporative standards for several nonroad categories:
1) Two tiers of emission standards are established for large spark-ignition engines over 19 kW. Tier 1 includes exhaust standards for HC+NOx and CO and was phased in from 2004-2006. Tier 2 became effective in 2007 and includes exhaust standards for HC+NOx and CO as well as evaporative controls affecting fuel line permeation, diurnal emissions and running loss emissions.
2) Exhaust and evaporative emission standards are established for recreational vehicles, which include snowmobiles, off-highway motorcycles, and all-terrain vehicles (ATVs). For snowmobiles, HC and CO exhaust standards are being phased-in from 2006-2012. For off-highway motorcycles, HC+NOx and CO exhaust emission standards were phased in from 2006-2007. For ATVs, HC+NOx and CO exhaust emission standards were phased in from 2006-2007. Evaporative emission standards for fuel tank and hose permeation apply to all recreational vehicles beginning in 2008.
3) Exhaust emission standards for HC+NOx, CO, and PM for recreational marine diesel engines over 50 hp during 2006-2009, depending on the engine displacement. These are ???Tier 2??? equivalent standards.
Control of Emissions of Air Pollution from Nonroad Diesel Engines and Fuel; Final Rule (Clean Air Nonroad Diesel Rule ??? Tier 4) 69 FR 38958, June 29, 2004. This final rule sets Tier 4 exhaust standards for CI engines covering all hp categories (except marine and locomotives), and also regulates nonroad diesel fuel sulfur content.
1) The Tier 4 start dates and pollutants affected vary by hp and tier as follows:
Rated Power | First Year that Standards Apply | PM (g/hp-hr) | NOx (g/hp-hr) | ||
hp < 25 | 2008 | 0.30 | - | ||
25 ??? hp < 75 | 2013 | 0.02 | 3.5* | ||
75 ??? hp < 175 | 2012-2013 | 0.01 | 0.30 | ||
175 ??? hp < 750 | 2011-2013 | 0.01 | 0.30 | ||
hp ??? 750 | 2011-2014 2015 | 0.075 0.02/0.03** | 2.6/0.50??? 0.50?????? |
* The 3.5 g/hp-hr standard includes both NOx and nonmethane hydrocarbons.
??? The 0.50 g/hp-hr standard applies to gensets over 1200 hp.
** The 0.02 g/hp-hr standard applies to gensets; the 0.03 g/hp-hr standard applies to other engines.
?????? Applies to all gensets only.
2) This rule will reduce nonroad diesel fuel sulfur levels in two steps. First, starting in 2007, fuel sulfur levels in nonroad diesel fuel will be limited to a maximum of 500 ppm, the same as for current highway diesel fuel. Second, starting in 2010, fuel sulfur levels in most nonroad diesel fuel will be reduced to 15 ppm.
Control of Emissions from Nonroad Spark-Ignition Engines and Equipment; Final Rule (Bond Rule), 73 FR 59034 October 8, 2008. This rule establishes exhaust and evaporative standards for small SI engines and marine SI engines.
1) Phase 3 HC+NOx exhaust emission standards are established for Class I NHH engines starting in 2012 and for Class II NHH engines starting in 2011. There are no new exhaust emission standards for handheld engines. New evaporative standards are adopted for both handheld and non-handheld equipment. The new evaporative standards control fuel tank permeation, fuel hose permeation, and diffusion losses. The evaporative standards begin in 2012 for Class I NHH engines and 2011 for Class II NHH engines. For handheld engines, the evaporative standards are phased-in from 2012-2016.
2) More stringent HC+NOx and CO standards are established for marine SI PWC/OB engines beginning in 2010. In addition, new exhaust HC+NOx and CO standards are established for stern-drive and inboard (SD/I) marine SI engines also beginning in 2010. High performance SD/I engines are subject to separate HC+NOx and CO exhaust standards that were phased-in from 2010-2011. New evaporative standards were also adopted for all marine SI engines that control fuel hose permeation, diurnal emissions, and fuel tank permeation emissions. The hose permeation, diurnal, and tank permeation standards take effect in 2009, 2010, and 2011, respectively.
On-Road Emissions Programs
In the 2007 heavy-duty highway rule, which is codified in 40 CFR Part 86, Subpart P, EPA set a PM emission standard for new heavy-duty engines of 0.01 grams per brake horsepower-hour (g/bhp-hr). This standard took full effect for diesel engines in the 2007 model year. This rule included standards for NOX and non-methane hydrocarbons (NMHC) of 0.20g/bhp-hr and 0.14g/bhp-hr, respectively. These diesel engine NOX and NMHC standards were successfully phased in together between 2007 and 2010. The rule also required that sulfur in diesel fuel be reduced to facilitate the use of modern pollution control technology on these trucks and buses. EPA required a 97% reduction in the sulfur content of highway diesel fuel -- from levels of 500 parts per million (ppm) for low sulfur diesel to 15ppm for ultra-low sulfur diesel. The reductions in sulfur content engendered similar reductions in SO2 emissions. These requirements were successfully implemented on the timeline in the regulation.
Federal Tier 1 New Vehicle Emission and New Federal Evaporative Emission Standards: Under CAA Section 202, EPA established federal motor vehicle emission standards (Tier I standards), which were phased in beginning with model year 1994. The benefits of this program are reflected in the 2002 base year inventory and the 2007 attainment year inventory. This federally implemented program affects light duty vehicles and light duty trucks. The regulations require more stringent exhaust emission standards as well as a uniform level of evaporative emission controls.
The Tier 2 vehicle and gasoline sulfur program, as codified in Subpart H of 40 CFR Part 80, 40 CFR Part 85, and 40 CFR Part 86, became effective in the 2005 model year. This program for fleet averaging of on-road vehicles is modeled after the California LEV II standards. The Tier 2 program allows manufacturers to produce vehicles with emissions ranging from relatively dirty to very clean, but the mix of vehicles a manufacturer sells each year must have average NOX emissions below a specified value. Mobile emissions continue to benefit from this program as motorists replace older, more polluting vehicles, with cleaner vehicles.
Delaware participated in the Ozone Transport Commission (OTC) National Low Emission Vehicle Program: Under the OTC National Low Emission Vehicle (NLEV) program, automobile manufacturers agreed to comply with tailpipe standards that were more stringent than EPA could mandate prior to model year 2004. For the OTC states, starting with the model year 1999 all new vehicles sold in the region must comply with the more stringent LEV standards. Once manufacturers committed to the program, the standards became enforceable in the same manner in which other federal motor vehicle emission control requirements were enforceable. The program was in place nationwide for model year 2001, and the benefits of this program are reflected in the 2002 base year inventory and the 2007 attainment year inventory.
In addition to the federal Tier 1 and 2 programs, NLEV, and the federal 2007 heavy duty highway rule, Delaware has instituted enhanced vehicle emissions inspection and maintenance (7 DE Admin. Code 1131-Low Enhanced Inspection and Maintenance) requirements in New Castle County and Kent County. The requirements involve mandating regional vehicle emission I/M programs that are stricter than basic programs, as required under Section182 and 202 of the CAA. Before 1994, basic automobile emissions testing checked only tailpipe emissions while idling and sometimes at 2,500 rpm. For Delaware, the Low Enhanced I/M procedures includes the use of On Board Diagnostic (OBD) system evaluations, fuel system pressure test and a gas cap test. The procedures also include an anti-tampering inspection of the catalytic converter, gas cap and fuel inlet restrictor. The OBD evaluations provide a more complete inspection, checking for excess evaporative emissions and other issues that might affect emissions from the vehicle.
5.0 SIP Completeness - Fully Approved SIP, Section 110 and Part D Requirements
5.1 EPA Requirements
States must provide assurances that the applicable implementation plan has been fully approved by EPA under Section 110(k) and must satisfy all requirements that apply to the area. An area cannot be redesignated if a required element of its plan is the subject of disapproval; a finding of failure to submit or to implement the SIP; or partial, conditional, or limited approval.
For purposes of redesignation, states must also meet all requirements of Section 110 and Part D of the CAA that were applicable prior to submittal of the complete redesignation request. The general elements required in a SIP are listed in Section 110(a). These elements include procedures for air quality monitoring and modeling; criteria for establishing stationary source controls, monitoring and reporting; implementation of permitting programs under Part C (Prevention of Significant Deterioration or PSD) and Part D (New Source Review or NSR); and provisions for public involvement. Subpart 1 of Part D consists of general requirements applicable to all areas which are designated nonattainment based on a violation of the NAAQS. Subpart 4 of Part D consists of more specific requirements applicable to particulate matter (specifically to address PM10). However, for the purpose of implementing the 1997 PM2.5 standard, the EPA???s Implementation Rule stated Subpart 1, rather than Subpart 4, is appropriate for the purpose of implementing PM2.5 (72 FR 20589).
5.2 Delaware Approach
Delaware submitted its annual PM2.5 attainment demonstration to EPA on April 5, 2008. It was subsequently revised to update onroad mobile emissions based on the MOVES model, and submitted to EPA on May 3, 2012. EPA has not completed rulemaking on the 2008 SIP or the May 3, 2012 Revision to the 2008 PM2.5 SIP. However, EPA Region 3 has recently informed DAQ that they have a Consent Decree which requires final action on Delaware???s attainment plan in December 2012.11 Therefore, Delaware expects that the 2008 attainment demonstration and its May 3, 2012 revision will be fully approved by the EPA as required under Section 110(k).
Section 110(a) of the CAA contains the general requirements for a SIP. Delaware concludes that, as EPA has stated in previous rulemaking,12 only the section 110 and part D requirements that are linked with a particular area???s designation are the relevant measures which DAQ may consider in evaluating a redesignation request. Further, DAQ believes that the other section 110 elements that are not connected with nonattainment plan submissions, and not linked with an area???s attainment status, are also not applicable requirements for purposes of redesignation. DAQ understands that a state remains subject to these requirements after an area is redesignated to attainment.
The requirements of section 110(a)(2) are statewide requirements that are not linked to the PM2.5 nonattainment status of the Philadelphia NAA. Therefore, DAQ believes that these SIP elements are not applicable requirements for purposes of review of the state???s PM2.5 redesignation request.
5.3 Part D Plan Requirements for Nonattainment Areas
Nonattainment Areas in General
CAA Section 172(c) ??? In April of 2008, DAQ submitted to EPA the Delaware State Implementation Plan for Attainment of the PM2.5 Annual National Ambient Air Quality Standard - Attainment Demonstration. Mobile budgets in the 2008 SIP were revised in January of 2012 in the SIP entitled, Proposed Revision to Delaware???s 2008 State Implementation Plan for Attainment of the PM2.5 Annual National Ambient Air Quality Standard - Attainment Demonstration, to account for changes in the new EPA model, MOVES. This plan demonstrated attainment of the annual PM2.5 NAAQS by 2010 based on implementation of a combination of federal measures, other regional controls, mobile source controls and local controls on industrial sources of direct PM2.5, NOx and SO2. In addition, the base year inventory requirement under CAA 172(c)(3) will be met when EPA fully approves the 2002 base year inventory submitted with the Delaware 2008 State Implementation Plan for Attainment of the PM2.5 Annual National Ambient Air Quality Standard - Attainment Demonstration. and the 2012 Proposed Revision to Delaware???s 2008 State Implementation Plan for Attainment of the PM2.5 Annual National Ambient Air Quality Standard - Attainment Demonstration.
CAA Section 176(c) was established under the CAA to address conformity. Conformity plays an important role in helping states and tribal regions improve air quality in those areas that do not meet the NAAQS. Under the separate general and transportation conformity rules, federal agencies must work with State, tribal, and local governments in nonattainment and maintenance areas to ensure that federal actions, including highway and transit projects, conform to the initiatives established in the applicable state or tribal implementation plan.
General Conformity
On November 30, 1993, EPA promulgated a set of regulations, known as the General Conformity Regulations, which apply to non-transportation projects (i.e., projects not adding or expanding highways and transit). These regulations ensured that these types of federal actions also conformed to the SIPs. (58 FR 63214) The purpose of the General Conformity Rule is to:
General conformity must be met for any federal action, defined as an activity engaged in by a department or agency of the federal government, or supported in any way by the federal government (including via financial assistance, licenses, permits, or approvals). The Federal Agency must make a determination that the activity conforms to the applicable State Implementation Plan before commencing the activity.
A conformity analysis must be conducted by the lead Federal Agency if a federal action would result in the generation of air emissions that would exceed conformity threshold levels of pollutants for which an air basin that is designated as a nonattainment or maintenance area under the NAAQS, or if emissions from the action are deemed regionally significant. A conformity analysis must demonstrate that the project emissions would conform, and thus would not degrade air quality in the impacted air basin. Conformity can be demonstrated via emission offsets, SIP provisions, or air quality modeling. The EPA is responsible for reviewing and approving SIPs, which are prepared and submitted to EPA by state environmental agencies.
Transportation Conformity
Transportation conformity is a provision in the CAA, which requires that a conformity demonstration be performed by either Federal Highway Administration (FHWA) or Federal Transit Administration (FTA) demonstrating that transportation-related highway construction will not interfere with achieving NAAQS. The concept of transportation conformity was introduced in the Clean Air Act of 1977, but the requirements became substantially more rigorous in the Amendments of 1990. The CAA and the Safe, Accountable, Flexible, Efficient Transportation Equity Act ??? A Legacy for Users (SAFETEA-LU), define the framework for effective integration of transportation and air quality planning.
Transportation conformity is a process by which it is determined that on-road mobile (highway) source emissions evaluated from the Transportation Improvement Program (TIP) and/or Long Range Transportation Plan (LRTP) will not adversely impact air quality in a determined area of nonattainment. Federal funding and approval are given to transportation activities that are consistent with air quality goals.
As discussed in more detail in Section 8 of this plan, Delaware revised its 2008 Annual PM2.5 Attainment Demonstration SIP in 2012, to address the emission factor changes in the new EPA MOVES model, and to establish new budgets for the purposes of addressing transportation conformity. Development of the 2008 PM2.5 SIP involved the interagency consultative process between EPA, DNREC, Delaware Department of Transportation and local transportation agencies such as the Wilmington Area Planning Council (WILMAPCO). WILMAPCO is the Metropolitan Planning Organization for New Castle County, Delaware and Cecil County, Maryland, and also facilitates the public participation process for stakeholders and citizens in the State of Delaware. The 2012 SIP revision to the April 2008 PM2.5 Attainment Demonstration SIP was a change to Delaware???s motor vehicle emissions budgets under the PM2.5 annual NAAQS, and was submitted to EPA on May 3, 2012.13 However, EPA has not completed rulemaking on the 2008 SIP and the May 3, 2012 Revision.
Delaware???s SIP contains provisions that are consistent with the Section176(c) conformity requirements. In Delaware???s SIP, general conformity requirements are contained in 7 DE Admin. Code 1135, Conformity of General Federal Actions to the State Implementation Plans, (Regulation for General Conformity), which was approved into the Delaware SIP by EPA on 08/11/2010. (75 FR 48566) Transportation conformity requirements are contained in 7 DE Admin. Code 1132, Transportation Conformity, which was approved into the Delaware SIP by EPA on 08/11/2010. (75 FR 48566)
6 Maintenance Plan
6.1 EPA Requirements
Section 107(d)(3)(E) of the CAA requires a maintenance plan to meet the requirements of Section 175(A). The maintenance plan constitutes a SIP revision and must provide for maintenance of the relevant NAAQS in the area for at least 10 years after redesignation, including contingency measures to ensure prompt correction of any violation of the NAAQS.
Section 175(A) further states that the plan shall contain such additional measures, if any, as may be necessary to ensure such maintenance. Mobile vehicle emission budgets for transportation conformity purposes are also established within the maintenance plans. States must submit a SIP revision eight years after the original redesignation request is approved to provide for maintenance of the NAAQS for an additional 10 years following the first 10-year period.
EPA provided guidance dated September 4, 1992 on the redesignation request and maintenance plan process in the memorandum from John Calcagni, Director, Air Quality Management Division to Regional Air Directions entitled Procedures for Processing Requests to Redesignate Areas to Attainment (redesignation and maintenance plan guidance). Other requirements are provided in 40 CFR 51 Subpart Z, entitled Provisions for Implementation of PM2.5 National Ambient Air Quality Standards (PM2.5 implementation rule). Additional guidance was received from EPA regional staff in the development of this maintenance plan through participation in the Mid-Atlantic Regional Air Management Association (MARAMA) PM2.5 workgroup, emails and conference calls, as well as reviewing and providing comments on the Technical Support Documents developed through the regional modeling efforts. EPA requires the following provisions to ensure maintenance of the NAAQS:
6.2 Delaware Approach
The State of Delaware has developed this maintenance plan which meets all of EPA requirements and demonstrates that because of permanent and enforceable measures, emissions over the 10 years following redesignation approval will remain below the 2007 attainment year levels while allowing for growth in population and vehicle miles traveled. The period covered by this maintenance plan is 2007 through 2025, with an interim year of 2017.
Delaware has developed an emissions inventory in accordance with EPA guidance that identifies the level of emissions sufficient to achieve the 1997 PM2.5 NAAQS. This attainment inventory consists of the actual 2007 emissions, i.e. a year during the three-year period associated with the 2007-2009 monitoring data showing attainment of the 1997 PM2.5 NAAQS. The plan includes a demonstration that emissions will remain beneath the 2007 levels for a 10-year period following redesignation, by keeping in place key elements of the current federal and state regulatory programs and putting in place additional controls.
As discussed in Section 3.5.1, the State of Delaware will continue to operate and maintain its air quality monitoring network. Delaware has the legal authority to implement and enforce specified measures necessary to attain and maintain the NAAQS.
In addition to maintaining key elements of its regulatory program, the State of Delaware will acquire air quality monitoring and source emissions data to track attainment and maintenance. The maintenance plan includes contingency measures, as necessary, to promptly correct any NAAQS violation that occurs after redesignation of the area.
The following sections provide detail on each of the above requirements, and the State of Delaware approach to meeting each requirement.
7 Attainment Inventory
7.1 EPA Requirements
The State of Delaware must develop an attainment year emissions inventory to identify the level of emissions sufficient to achieve the NAAQS. This inventory should be consistent with EPA's most recent guidance on emission inventories for nonattainment areas available at the time, and should include emissions during the time period associated with the monitoring data showing attainment of the 1997 PM2.5 NAAQS. Where a state has made an adequate demonstration that air quality has improved as a result of their State Implementation Plan (SIP), the attainment inventory will generally be the actual inventory during the time period the area attained the standard. The inventory should be based on annual emissions of SO2, NOX, and primary PM2.5 in units of tons per year (tpy) during the attainment year.
7.2 Delaware Approach
The State of Delaware developed an attainment year emissions inventory that identifies the level of emissions sufficient to achieve the 1997 PM2.5 NAAQS. The attainment inventory consists of actual emissions for a year during the three-year period associated with the monitoring data showing attainment of the PM2.5 standard, that is, 2007 for the annual NAAQS maintenance plan. The 2007 inventory is appropriate to use because it represents the typical inventory for the three-year period demonstrating attainment of the standard. The 2007 inventory is consistent with EPA inventory guidance; is based on annual emissions of SO2, NOX, and primary PM2.5 during 2007; and contains a list of sources and emissions in tpy.
7.3 2007 Attainment Year Inventory
The Delaware DAQ, in conjunction with MARAMA, New Jersey and Pennsylvania DEQs prepared a comprehensive emissions inventory for each county in the Philadelphia NAA, including point, area, and on-road and off-road mobile sources for primary PM2.5 as well as precursors of PM2.5 (NOx and SO2) for the year 2007. MARAMA and the Philadelphia NAA air control agencies selected 2007 emissions data to represent the ???attainment year??? since it falls within the 3-year period (2007-2009) which demonstrates monitored attainment. Furthermore, 2007 was planned as the base year for the Ozone Transport Commission???s (OTC) modeling work for ozone State Implementation Plans (SIP), and as such has undergone extensive quality assurance.
This inventory is based on actual activity levels. Point source information was compiled from 2007 Annual Emissions Reports (AERs) submitted to the Delaware DAQ by emissions sources. Area source emissions were calculated using the most recently available methodologies and emissions factors from EPA along with activity data (typically population, employment, fuel use, etc.) specific to 2007. On-road mobile source emissions were calculated using EPA???s Motor Vehicle Emission Simulator (MOVES) model with 2007 vehicle miles traveled (VMT) data provided by the Delaware Department of Transportation (DelDOT). Off-road mobile source exhaust emissions, such as those from lawn and garden equipment, agricultural equipment, and construction equipment were calculated for 2007 using EPA???s National Mobile Inventory Model (NMIM) emissions model. Emissions sources such as commercial marine vessels, aircraft and locomotives (MAR) were not included in the NMIM model and were calculated separately. Biogenic emissions were not included in these summaries. Details of how the inventory was developed can be found in following document: Technical Support Document for the Development of the 2007 Emission Inventory for Regional Air Quality Modeling in the Northeast / Mid-Atlantic Region.
Table 7-1 Summarizes the 2007 emissions estimates for the New Castle County portion of the Philadelphia NAA.
Table 7-1 2007 New Castle County Emissions (tpy)
Source Sector | 2007 Annual Emissions (TPY) | ||
NOx | PM25 | SO2 | |
Area | 1,293 | 1,207 | 630 |
Nonroad MAR | 2,825 | 171 | 1,027 |
Nonroad NMIM | 1,755 | 156 | 91 |
Onroad MOVES | 10,577 | 324 | 100 |
Point EGU | 2,865 | 519 | 9,119 |
Point nonEGU | 3,770 | 816 | 4,261 |
All Sectors | 23,084 | 3,193 | 15,228 |
Note: due to rounding, total tpy may be off by 1 ton.
8 Maintenance Demonstration
8.1 EPA Requirements
The 1992 EPA Calcagni Memo14, entitled Procedures for Processing Requests to Redesignate Areas to Attainment, discusses how states may demonstrate maintenance of the NAAQS by showing that future emissions of a pollutant or its precursors will not exceed the level of the attainment inventory. The demonstration should be for a period of 10 years following the redesignation. The projected inventory should consider future growth, including population and industry. It should also be consistent with the attainment inventory, and it should document data inputs and assumptions. All elements of the demonstration should be consistent with current EPA guidance. Enforceability through regulations must also be demonstrated.
The Calcagni Memo goes on to say that any assumptions concerning emission rates must reflect permanent, enforceable measures. States generally cannot take credit for reductions unless there are regulations in place requiring those reductions or the reductions are otherwise shown to be permanent. Therefore, states are expected to maintain the implemented control strategy despite redesignation to attainment, unless such measures are shown to be unnecessary for maintenance or are replaced with measures that achieve equivalent reductions. Emission reductions from source shutdowns can be considered permanent and enforceable to the extent that those shutdowns have been reflected in the SIP and all applicable permits have been modified accordingly.
8.2 Delaware Approach
A Maintenance Plan must contain a demonstration that the level of emissions projected for the ten-year period following redesignation is sufficient to maintain the NAAQS. Because Delaware intends to submit this Plan in 2012, and EPA has a maximum of 18 months to approve it,15 the EPA approval date for redesignation is expected to be before 2015, and ten (10) years after that is 2025. Accordingly, DAQ projected PM2.5, NOx, and SO2 emissions for 2025 to represent the end year of the maintenance plan. DAQ also projected emissions to 2017 to represent an interim year during the maintenance period. Emissions for the 2017 and 2025 projection years are compared to emissions levels in 2007 to determine if emissions are sufficient to maintain the NAAQS during this period, i.e. they must be lower than 2007.
8.2.1 2017 and 2025 Projection Inventories
As was done with the 2007 attainment year, 2017 and 2025 projection inventories were develop through the MARAMA regional planning process. For 2025 emission projections, the emission methodologies and growth factors can be found in the Technical Support Document for the Development of the 2025 Emission Inventory for PM2.5 Nonattainment Counties in the MANE-VU Region, January 2012 (MARAMA 2025 TSD). For 2017 emission projections, the emission methodologies and growth factors can be found in the Technical Support Document for the Development of the 2013/2017/2020 Emission Inventories for Regional Air Quality Modeling in the Northeast/Mid-Atlantic Region (MARAMA 2017 TSD).
New Castle County point and area source emissions for 2017 and 2025 were estimated using the 2007 attainment inventory and growth/control factors appropriate for each source category. EGU emissions were projected using Department of Energy 2011 Annual Energy Outlook growth factors, with control factors applied due to Delaware???s EGU regulations (7 DE Admin. Code 1146 Electric Generating Unit Multi-Pollutant Regulation, and 7 DE Admin. Code 1148 Control of Stationary Combustion Turbine Electric Generating Unit Emissions). Off-road emissions projections were developed using the growth factors contained in EPA???s NMIM model.
For mobile budget purposes Delaware is using the 2012 mobile emissions from its PM2.5 Attainment Demonstration Revision, submitted to EPA on May 3, 2012. Delaware used 2012 mobile emissions in lieu of projected mobile emissions because:
1. They are based on the most up-to-date mobile source assumptions available.
2. 2012 emission budgets are 41% and 39% less than the onroad NOx and PM2.5 found in the 2007 attainment year. (see table 8-2 and 8-3)
3. Additional reductions are not necessary in the context of this maintenance plan.
The 2012 emission inventory modeling of the on-road mobile source sector was performed by WRA Associates LLP, Wilmington, Delaware, under contract to DelDOT with technical support from the Division of Air Quality (DAQ) staff. The on-road mobile sources cover all highway vehicles including passenger cars, light-duty trucks, sport utility vehicles, heavy-duty trucks, buses, and motorcycles, which travel on Delaware???s roadways in 2012. Delaware Department of Transportation (DelDOT) staff provided the vehicle miles traveled (VMT) on Delaware???s roadways. DAQ staff also evaluated all information concerning control measures that would be effective in 2012. With the vehicle mix data and control information, the EPA???s MOVES model was used to generate monthly emissions for PM2.5, oxides of nitrogen and SO2. After QC/QA reviews and revision by DAQ staff the emission data were finalized, and included in the final inventory. The on-road mobile source controls for New Castle County in the input files for the 2012 MOVES model runs include the following:
1. Low enhanced I/M program of model years 1968 through 1995
2. On-Board Diagnostic checks of model years 1996 and newer.
3. National Low Emission Vehicle program,
4. Tier 2 emission standards/low sulfur rule.
5. Heavy Duty Diesel Rule/low Sulfur rule.
Table 8-1 provides a comparison of emissions for the years 2007, 2017 and 2025. The table demonstrates that the level of emissions projected through the maintenance period are less than emissions estimated for the attainment year and are, therefore, sufficient to maintain the PM2.5 NAAQS. Tables 8-2 through 8-4 show NOx, PM2.5 and SO2 reductions (tpy) between 2007 and 2017 and 2025. The tables also provide the percent reduction of NOx, PM2.5 and SO2 by sector for those same years. It is readily apparent from these tables that SO2 and NOx emissions are expected to decrease significantly between 2007 and 2025, i.e. 40% and 54% for NOx and SO2, respectively. PM2.5 decreases less significantly (14%). Projected emissions of those pollutants for the mid-point year of 2017 are also significantly less than their respective emissions levels in 2007. Based on these emissions trends it is expected that air quality will continue to meet the PM2.5 NAAQS throughout the maintenance period.
Table 8-1 Comparison of emissions for the years 2007, 2017 and 2025
Sector | NOx | PM2.5 | SO2 | ||||||
2007 | 2017 | 2025 | 2007 | 2017 | 2025 | 2007 | 2017 | 2025 | |
Area | 1,293 | 1,295 | 1,296 | 1,207 | 1,235 | 1,310 | 630 | 521 | 469 |
Nonroad MAR | 2,825 | 1,810 | 1,279 | 171 | 61 | 44 | 1,027 | 112 | 37 |
Nonroad-NMIM | 1,755 | 997 | 837 | 156 | 106 | 103 | 91 | 2 | 3 |
Onroad MOVES | 10,577 | 6,273 | 6,273 | 324 | 199 | 199 | 100 | 98 | 98 |
Point ??? EGU | 2,865 | 1,698 | 1,758 | 519 | 502 | 520 | 9,119 | 2,419 | 2,572 |
Point - nonEGU | 3,770 | 2,402 | 2,355 | 816 | 742 | 716 | 4,261 | 3,843 | 3,780 |
All Sectors | 23,084 | 14,475 | 13,797 | 3,193 | 2,844 | 2,893 | 15,228 | 6,995 | 6,958 |
Table 8-2 Reductions and % Change of NOx emissions for the years 2007, 2017 and 2025
NOx | Reduction (tpy) | Change (%) | Reduction (tpy) | Change (%) | |||
Sector | 2007 | 2017 | 2025 | 2007-2017 | 2007 to 2017 | 2007 to 2025 | 2007 to 2025 |
Area | 1,293 | 1,295 | 1,296 | -3 | 0.2% | -3 | 0.2% |
Nonroad MAR | 2,825 | 1,810 | 1,279 | 1,015 | -35.9% | 1,546 | -54.7% |
Nonroad-NMIM | 1,755 | 997 | 837 | 758 | -43.2% | 918 | -52.3% |
Onroad MOVES | 10,577 | 6,273 | 6,273 | 4,304 | -40.7% | 4,304 | -40.7% |
Point ??? EGU | 2,865 | 1,698 | 1,758 | 1,167 | -40.7% | 1,107 | -38.7% |
Point - nonEGU | 3,770 | 2,402 | 2,355 | 1,368 | -36.3% | 1,415 | -37.5% |
Total tpy | 23,084 | 14,475 | 13,797 | 8,609 | -37% | 9,287 | -40% |
Table 8-3 Reductions and % Change of PM2.5 emissions for the years 2007, 2017 and 2025
PM2.5 | Reduction (tpy) | Change (%) | Reduction (tpy) | Change (%) | |||
Sector | 2007 | 2017 | 2025 | 2007 to 2017 | 2007-2017 | 2007 to 2025 | 2007 to 2025 |
Area | 1,207 | 1,235 | 1,310 | -28 | 2.3% | -103 | 8.5% |
Nonroad MAR | 171 | 61 | 44 | 110 | -64.2% | 126 | -74.0% |
Nonroad-NMIM | 156 | 106 | 103 | 51 | -32.5% | 53 | -34.0% |
Onroad MOVES | 324 | 199 | 199 | 125 | -38.6% | 125 | -38.6% |
Point ??? EGU | 519 | 502 | 520 | 17 | -3.2% | -1 | 0.2% |
Point - nonEGU | 816 | 742 | 716 | 75 | -9.1% | 100 | -12.2% |
Total tpy | 3,193 | 2,844 | 2,893 | 349 | -11% | 301 | -9% |
Table 8-4 Reductions and % Change of SO2 emissions for the years 2007, 2017 and 2025
SO2 | Reduction (tpy) | Change (%) | Reduction (tpy) | Change (%) | |||
Sector | 2007 | 2017 | 2025 | 2007 to 2017 | 2007-2017 | 2007 to 2025 | 2007 to 2025 |
Area | 630 | 521 | 469 | 109 | -17.4% | 161 | -25.6% |
Nonroad MAR | 1,027 | 112 | 37 | 915 | -89.1% | 990 | -96.4% |
Nonroad-NMIM | 91 | 2 | 3 | 89 | -97.3% | 88 | -96.5% |
Onroad MOVES | 100 | 98 | 98 | 2 | 2.4% | 2 | 2.4% |
Point - EGU | 9,119 | 2,419 | 2,572 | 6,700 | -73.5% | 6,547 | -71.8% |
Point - nonEGU | 4,261 | 3,843 | 3,780 | 418 | -9.8% | 482 | -11.3% |
Total tpy | 15,228 | 6,995 | 6,958 | 8,234 | -54% | 8,271 | -54% |
8.22 2017 and 2025 Mobile Source Emissions Budgets
Transportation conformity is a way to ensure that federal funding and approval are given to those transportation activities that are consistent with air quality goals. Transportation activities should not worsen air quality or interfere with an area???s continued compliance in regards to the 1997 PM2.5 NAAQS. The federal transportation conformity rule is codified in 40 CFR Part 93, subpart a, entitled Determining Conformity of Federal Actions to State or Federal Implementation Plans (transportation conformity rule). This rule applies to areas designated as nonattainment for one or more NAAQS or that have been redesignated to attainment with federally approved air quality maintenance plans. The responsible transportation planning entities for the New Castle County, Delaware potion of the Philadelphia 1997 PM2.5 NAA is the Delaware Department of Transportation (DelDOT) and the Wilmington Area Planning Council (WILMAPCO). In the transportation conformity process, overall emissions estimates by analysis year that take into account future traffic activity and projects expected to be completed are compared to a base year, a no build scenario, or emission budgets. Emission budgets are used in this maintenance plan determination only if EPA has approved or found adequate emissions budgets that have been submitted as a SIP revision.
The purpose of this section is to describe and establish the New Castle County motor vehicle emissions budgets associated with the PM2.5 Maintenance Plan SIP. Annual motor vehicle emissions budgets are being proposed for the final year of the Maintenance Plan, 2025. The Maintenance Plan also includes motor vehicle emissions budgets for the interim year 2017.
Delaware is establishing mobile budgets for PM2.5 and NOx.16 Ammonia and volatile organic compounds (VOC) are precursors; however, they are not considered significant overall contributors to PM2.5 air quality issues, as noted in the PM2.5 implementation rule at 40 CFR 51.1002(c)(3). For other pollutants such as SO2, the highway contribution to those emissions may be insignificant. In that case, the transportation conformity rule allows such pollutants and precursors to be exempt from conformity analysis under certain circumstances:
40 CFR93.109 (k) Areas with insignificant motor vehicle emission
Notwithstanding the other paragraphs in this section, an area is not required to satisfy regional emissions analysis for ??93.118 and/or ??93.119 for a given pollutant/precursor and NAAQS, if EPA finds through the adequacy or approval process that a SIP demonstrates that regional motor vehicle emissions are an insignificant contributor to the air quality problem for that pollutant/precursor and NAAQS. The SIP would have to demonstrate that it would be unreasonable to expect that such an area would experience enough motor vehicle emissions growth in that pollutant/precursor for a NAAQS violation to occur. Such a finding would be based on a number of factors, including the percentage of motor vehicle emissions in the context of the total SIP inventory, the current state of air quality as determined by monitoring data for that NAAQS, the absence of SIP motor vehicle control measures, and historical trends and future projections of the growth of motor vehicle emissions.
A motor vehicle emissions budget is that portion of the total allowable emissions allocated to highway and transit vehicle use that are defined in the SIP for a certain year. The rules governing transportation conformity require certain transportation activities to be consistent with motor vehicle emissions budgets contained in control strategy implementation plans (40 CFR ?? 93.118). Section 93.101 of the rule defines a ???control strategy [State] implementation plan revision??? as a ???plan which contains specific strategies for controlling the emissions and reducing ambient levels of pollutants in order to satisfy CAA requirements of reasonable further progress and attainment.??? In order to demonstrate conformity to the motor vehicle emissions budget, emissions from the implementation of a transportation plan or a transportation improvement program (TIP) must be less than or equal to the budget level (40 CFR ?? 93.118(a)).
The 2012 budgets established in Delaware???s May 3, 2012 PM2.5 Attainment Demonstration SIP revision (submitted to EPA on 5/3/2012) represent a level of mobile emissions lower than what existed during the years attainment was reached (i.e., 2007-2009 and 2008-2010). Further, mobile reductions are not necessary to demonstrate maintenance, and the 2025 NOx and PM2.5 emissions are well below 2007 levels. As such, there is no need to develop new mobile budgets at this time. Therefore, Delaware proposes to use existing 2012 budgets for the 2017 interim year, as well as the end year, 2025.17
Table 8-5 summarizes the budgets for each relevant year.
Table 8???5 New Castle County Maintenance Plan On-Road Mobile Source Emissions Budgets
Year | NOX On-Road Emissions (tpy) | PM2.5 On-Road Emissions (tpy) |
2012 Attainment SIP Revision ??? Mobile Budgets | 6,273 | 199 |
2017 Interim Budget | 6,273 | 199 |
2025 Final Budget | 6,273 | 199 |
MOVES model 2012 inputs and outputs for NOx and PM2.5 may be found in Delaware???s final revision to the 2008 State Implementation Plan for Attainment of the PM2.5 Annual National Ambient Air Quality Standard - Attainment Demonstration. That SIP revision was submitted to EPA on May 3, 2012.
8.2.3 Control Measures for Maintenance of Good Air Quality
Point, area, non-road and on-road emission projections for 2017 and 2025 include a variety of control strategies that will continue to reduce emissions of PM2.5, NOX, and SO2 in the future years. The sections below describe the major control programs in each category. Many of these programs are federal programs that are enforced on a regional or national level. In cases where the programs are delegated programs or state programs, EPA has approved these programs into the Delaware SIP. The State of Delaware commits to continue to implement and enforce these programs as appropriate to ensure that reductions assumed in 2017 and 2025 will be achieved.
Tables 8-2 through 8-4 show that projected 2007 to 2025 reductions are 9,287 tpy for NOx, 301 tpy for PM2.5 and 8,271 tpy for SO2. In terms of percent reductions, this equates to 40%, 9% and 54% reductions of NOx, PM2.5 and SO2, respectively. The same tables show projections from 2007 to the 2017 interim year. 2007-2017 reductions are 8,609 tpy for NOx, 349 tpy for PM2.5 and 8,234 for SO2. In terms of percent reductions, this equates to 37%, 11% and 54% reductions of NOx, PM2.5 and SO2, respectively.
However, not all of these reductions are due to control measures. Projected emissions can be higher or lower due to growth factors alone, or in combination with controls (assuming controls exist for a certain source category). DAQ calculated reductions that will occur after 2007 due only to control measures, (no growth), for EGUs, non-EGU point sources, area and ???marine, aircraft and locomotive??? (MAR) sources. Because onroad and non-MAR off-road sources are estimated using EPA models (MOVES and NMIM), and inherently include growth in the form of fleet turnover, equipment turnover, ex. lawnmowers, etc., it is not feasible to break out onroad and non-MAR off-road reductions due exclusively to controls. The same rationale applies to residential wood combustion, which also relied on an EPA model. Table 8-7 shows the reduction due to controls and the control measure by source sector.
Looking at Table 8-6, it is evident that all but the area source sectors had significant decreases for NOx, SO2 and/or PM2.5 due to control measures.
Table 8-6 Post-2007 Emission Reductions due to Control Measures
Source Sector | NOx | PM2.5 | SO2 |
EGUs | |||
DE Admin Code 1146 (Multi-Pollutant Regulation) | 1,240.8 | 10.5 | 6,562.4 |
nonEGU | |||
Delaware City Refinery NOx CAP (1650 tpy) post-2015 | 1,157.26 | 0.00 | 0.00 |
Reciprocating Internal Combustion Engines - Maximum Achievable Control Technology, (RICE MACT) (76 FR 12863) | 0.02 | 0.08 | 0.00 |
Chrysler Plant Shutdown /unit shutdown | 6.50 | 0.89 | 16.64 |
AREA | |||
RICE MACT | 42.51 | 0.30 | 0.00 |
EPA New Source Performance Standards for Woodstoves (NSPS). These standards are codified at 40 CFR part 60, subpart AAA. The final standards were promulgated in 1988 (53 FR 5860). | 5.00 | 76.64 | 0.84 |
Nonroad (NMIM model) | 918 | 53 | 88 |
ONROAD (MOVES model) | 4,304 | 125 | 2 |
Marine Vessels, Aircraft and Locomotives (MAR) | |||
Control of Emissions of Air Pollution From Locomotive Engines and Marine Compression-Ignition Engines Less Than 30 Liters per Cylinder; Republication; Final Rule. (73 FR 37096) | 933 | 37 | 152 |
Control of Emissions From New Marine Compression-Ignition Engines at or Above 30 Liters per Cylinder(75 FR 22895) | 631 | 90 | 836 |
TOTALS | 9,241 | 394 | 7,660 |
8.2.4 Delaware-specific NOx, PM2.5 or SO2 Control Measures (Effective Post 2007)
EGU reductions
EGUs are a subset of point source emissions and include the following New Castle County facilities:
Of these facilities, Edge Moor is the only one which had coal-burning units and residual oil in 2007. The rest used either natural gas or distillate oil, and thus had small PM2.5 and SO2 emissions in 2007 and are projected to have small emissions of PM2.5 and SO2 emissions in 2025. Consequently, Edge Moor was the largest EGU emitter, e.g. its 2007 emissions represented 90%, 92% and 99.9% of NOx, PM2.5 and SO2, respectively for all New Castle County EGUs. Because Units 3 and 4 were coal-fired in 2007, and Unit 5 operates primarily on residual oil, the Edge Moor facility is subject to 7 DE Admin. Code 1146, EGU Multi-pollutant Regulation, 7 DE Admin. Code 1146, is a non-trading program/regulation that was established primarily as a measure to aid in the attainment of the ozone and fine particulate matter ambient air quality standards.
7 DE Admin. Code 1146 will reduce 2007 EGU emissions by 1,241 tpy NOx, 10.5 tpy PM2.5 and 6,562 tpy SO2 in 2025 (see Table 8-7). PM2.5 emission controls are not directly regulated under 7 DE Admin. Code 1146, but are a co-benefit of the 0.5% by weight low-sulfur residual oil limit on Unit 5.
Non-EGU reductions
The Chrysler automotive plant ceased commercial operation in January, 2009. However, only a 25% reduction was applied, since Chrysler maintains 50% of the emission credits and the Delaware Economic Development Office retains the remaining 25%.
Delaware Onroad
In additional to the federal Tier 1 and 2 programs, NLEV, and the federal 2007 heavy duty highway rule, Delaware has instituted Enhanced Vehicle Emissions Inspection And Maintenance (enhanced I/M) requirements in New Castle County. The requirements involve mandating regional vehicle emission I/M programs that are stricter than basic programs, as required under ????182 and 202 of the CAA. Before 1994, basic automobile emissions testing checked only tailpipe emissions while idling and sometimes at 2,500 rpm. Enhanced I/M procedures include the use of On Board Diagnostic (OBD) system evaluations. The OBD evaluations provide a more complete inspection, checking for excess evaporative emissions and other issues that might affect emissions from the vehicle. Delaware???s enhanced I/M program was approved into the Delaware SIP by EPA on September 30, 1999 (64 FR 52657). Revisions to the enhanced I/M program were approved by EPA on 11/26/2003 (68 FR 228).
8.2.5 Federal Control Measures (Effective or Phased-in Post 2007)
Federal control measures that are either effective or phased in after 2007 are the same as those discussed in Section 4.3.2. Note that the Woodstove NSPS and many of the nonroad and onroad federal control measures have effective dates prior to, during, or after 2007. However, other than fuel standards; all of the measures are phased in over many years through fleet or equipment ???turnover.??? For example, in the case of nonroad sources, fleet turnover includes sales of new engines replacing older ones over the years. Therefore, it is expected that reductions will continue well past the 2007 attainment year.
8.2.6 Future Emissions Reductions Programs
Delaware
New Delaware regulations will reduce emissions of NOx, PM2.5 and SO2 even further, although these rules are not yet finalized and therefore were not considered in the 2017 and 2025 estimates included in this document. Measures under development or consideration are:
Federal
Three new federal regulations may reduce emissions of SO2 even further. These rules were not considered in the 2017 and 2025 estimates included in this document. However, these rules and the new SO2 NAAQS each should facilitate significant further reductions, both within and outside the Philadelphia maintenance area.
8.2.7 Controls to Remain in Effect
Delaware will maintain all of the control measures listed in this Section to ensure maintenance of the annual PM2.5 NAAQS. Any revisions to the control measures included as part of this maintenance plan will be submitted as a SIP revision to EPA for approval, and will be accompanied by a showing that such changes will not interfere with maintenance of the NAAQS. The Delaware DAQ has the necessary resources to enforce any violations of its rules or permit provisions. After redesignation to attainment Delaware intends to continue enforcing all rules that relate to the emissions of primary PM2.5 and precursors to secondary PM2.5 which may impact New Castle County ambient PM2.5 concentrations.
Although Delaware believes that control of organic compounds and ammonia may help improve PM air quality, reductions from the control of organics or ammonia, have not been relied upon in this maintenance plan, consistent with the PM2.5 Implementation Rule.
9 Verify Continued Attainment
9.1 EPA Requirements
States must ensure that they have the legal authority to implement and enforce all measures necessary to attain and maintain the NAAQS. Sections 110(a)(2)(B) and (F) of the CAA suggest that one such measure is the acquisition of air quality and source emission data to demonstrate attainment and maintenance.
9.2 Delaware Approach
The State of Delaware has the legal authority to implement and enforce specified measures necessary to attain and maintain the 1997 annual NAAQS. In addition to maintaining key elements of its regulatory program in place in Delaware???s SIP, Delaware will acquire ambient monitoring and source emission data to track attainment and maintenance as described in Sections 3 and 7. Delaware will also track the progress of the maintenance demonstration by periodically updating the emissions inventory as required by the Annual Air Emissions Reporting Requirements Rule, or as required by federal regulation during the maintenance plan period. This includes developing annual inventories for major point sources and a comprehensive periodic inventory covering all source categories every three years. Tracking will include the evaluation of annual and periodic evaluations for any significant emission increases above the 2007 attainment year levels.
10 Contingency Measures
10.1 EPA Requirements
Section 175(A) of the CAA specifies the requirements for Maintenance Plans, including provisions for contingency measures that will be implemented if violations of the annual PM2.5 NAAQS are measured after redesignation to attainment. A list of potential contingency measures that would be implemented in such an event should also be included in the Maintenance Plan. Finally, the plan should provide a commitment to submit a revised Maintenance Plan eight years after redesignation to ensure continued maintenance for the next ten-year maintenance period.
Contingency measures are intended to provide further emissions reductions in the event that violations of the annual PM2.5 NAAQS occur after redesignation to attainment. While these measures do not need to be fully adopted by the State of Delaware prior to the occurrence of NAAQS violations, the contingency plan should ensure that the contingency measures are adopted expeditiously once they are triggered. The Maintenance Plan must identify the triggers that determine when contingency measures will be adopted, and the measures that the state will consider. It should also include a schedule and procedures for adoption and implementation, and a specific time limit for action. Specific triggers that would put the plan into motion must be identified. This plan is considered to be an enforceable part of the SIP and should ensure that the contingency measures are adopted explicitly once they are triggered.
10.2 Delaware Approach
Consistent with this plan, Delaware agrees to adopt and implement the necessary corrective actions in the event that violations of the annual PM2.5 NAAQS occur within the Philadelphia maintenance area after its redesignation to attainment.20 As described in Section 5 of this report, EPA and Delaware have adopted and are continuing to implement a range of control measures that will greatly reduce precursor emissions locally, statewide and nationwide. Delaware commits to continue to implement the identified statewide and local control measures. The Delaware DAQ anticipates that post-2007 emissions reductions will be sufficient to mitigate exceedances or violations of the annual PM2.5 NAAQS that may occur in the coming years without further regulatory action. However, in the event of a future violation or exceedance of the annual PM2.5 NAAQS, the Delaware DAQ will use the following triggers (determination of when to start an action) and perform the following actions in accordance with the described schedule, as its contingency plan:
1. Warning Level Response (one or both of the following events occur):
a. A warning level response shall be prompted whenever the annual PM2.5 concentration of 15.1 ??g/m3 or greater occurs in a single calendar year within the Philadelphia maintenance area.
b. The New Castle County, Delaware maintenance area total PM2.5, NOx and SO2 emissions increase more than 10% above the levels in the 2007 attainment year emissions inventory.
2. Action Level Response
An action level response shall be prompted whenever a two-year average of the annual PM2.5 concentration is 15.1 ??g/m3 or greater occurs within the Philadelphia maintenance area. A violation of the standard (three-year average of 15.1 ??g/m3 or greater) shall also prompt an action level response.
3. Study and data analysis
In order to select appropriate corrective measures for warning or action level triggers, the Delaware DAQ will work independently, or in conjunction with the States of Pennsylvania and New Jersey, and the City of Philadelphia to conduct a comprehensive study to determine the causes of the violation and the control measures necessary to mitigate the problem. This analysis may include all or some of the following factors as necessary, to determine the cause of the exceedance, emissions increase or violation:
The study will evaluate whether the trend, if any, is likely to continue and if so, the control measures necessary to reverse the trend taking into consideration ease and timing for implementation as well as economic and social considerations. In the event that the trigger is not found to be due to an exceptional event, malfunction, or noncompliance with a permit condition or rule requirement, Delaware DAQ will work with the States of Pennsylvania and New Jersey, and the City of Philadelphia as necessary, to determine additional control measures needed to assure future attainment of the 1997 annual PM2.5 NAAQS.
Based on the results of the analysis, contingency measures will be selected from those listed below, or from any other measure deemed appropriate and effective at the time the selection is made. However, if a new measure or control is already promulgated and scheduled
to be implemented at the federal or state level at such time after the exceedance, and that measure or control is determined to be sufficient to address the upward trend in air quality, additional local measures may be unnecessary. The selection between measures will be based upon cost-effectiveness, emissions reduction potential, ease and timing of implementation, and other appropriate factors.
Adoption of any additional control measures will be subject to the necessary administrative and legal processes. The Delaware DAQ will solicit input from all interested and affected persons in the area prior to selecting appropriate control measures. No contingency measure shall be implemented without providing the opportunity for full public participation during which the relative costs and benefits of individual measures, at the time they are under consideration, can be fully evaluated. This process will include publication of notices, an opportunity for public hearing, and other measures required by Delaware law.
4. Timing of contingency measure implementation
A timeline for the development of NOx, PM2.5 and/or SO2 regulations or permit conditions follows. This schedule initiates with certification of ambient air quality monitoring data indicating a violation of the annual PM2.5 NAAQS:
a. Warning Level Response
Should a warning level response be triggered, measures that can be implemented in a short time will be selected in order to be in place within 18 months from the close of the calendar year that prompted the warning level.
b. Action Level Response
Should an action level response be triggered, implementation of necessary controls measures will take place as expeditiously as possible, but in no event later than 18 months after the Delaware DAQ makes a determination, based on quality-assured ambient data, that a violation of the NAAQS has occurred.
Table 10-1 Schedule for Permit Revisions or Rule Revisions for Contingency Measures21
Identify and quantify the emissions reductions expected to result in the future from existing and future state and federal regulatory programs. | 3 months |
Use the best available air quality modeling to evaluate the air quality improvement expected to result in the Philadelphia MA from the programs and emissions reductions identified in 10.2.5 of this document. | 6 months |
Draft any needed permit conditions or SIP regulations. | 3 months |
Complete rulemaking or permit revision process and submit to EPA. | 6 months |
Completion no later than: | 18 months |
5. List of Potential Contingency Measures
11 Other Delaware Commitments
11.1 Commitment to Revise Plan
Delaware DAQ commits to submit a second 10-year Maintenance Plan eight years after redesignation to attainment, as required by Section 175(A)(b) of the CAA. The Maintenance Plan revision is intended to ensure continued attainment of the annual PM2.5 NAAQS for an additional ten-year period.
11.2 Public Participation
In accordance with Section 110(a)(2) of the CAA, Delaware is required to have a public comment period and provide the opportunity for a public hearing on this Maintenance Plan prior to adoption. Public participation in the Delaware SIP process is required by Delaware law22 as follows:
12 Conclusions
The Philadelphia nonattainment area has attained the 1997 annual PM2.5 NAAQS and has complied with the applicable provisions of the CAA required of the PM2.5 NAAQS. Delaware demonstrated that the Philadelphia NAA has attained the 1997 annual PM2.5 NAAQS and that the air quality improvements are due to permanent and enforceable control measures.
The Delaware DAQ has prepared a Maintenance Plan that meets the requirement of 175A of the Clean Air Act. This Maintenance Plan provides for the continued attainment of the 1997 annual PM2.5 NAAQS for a period of at least ten years after EPA has formally redesignated the area to attainment. This Maintenance Plan provides adequate contingency measures for potential, additional emissions reductions in the event that future violations of the 1997 annual PM2.5 NAAQS are observed in the area.
Delaware has performed an analysis that shows the air quality improvements are due to permanent and enforceable measures and that additional significant regional NOx and SO2 reductions following implementation of federal and state measures will ensure continued compliance (maintenance), with the standard. Furthermore, emission projections in the Maintenance Plan indicate that NOx, PM2.5 and SO2 emissions will continue to decline, ensuring that the area continues to maintain compliance with the standard and provide for an increased margin of safety.
The Delaware DAQ has prepared a comprehensive emissions inventory of PM2.5 and its precursors for the base year, 2002 to meet CAA 172(c)(3) requirements, as submitted to EPA April, 5 2008, in the Delaware State Implementation Plan for Attainment of the PM2.5 Annual National Ambient Air Quality Standard - Attainment Demonstration.
The Delaware DAQ has prepared a comprehensive emissions inventory of PM2.5 and its precursors for the attainment year (2007), and has prepared projections of the emissions inventory to 2017 and 2025. These emissions projections indicate that emissions levels in the New Castle portion of the Philadelphia NAA will continue to remain much lower than emissions from the attainment year 2007 levels, thereby maintaining the PM2.5 NAAQS in future years.23 The Delaware DAQ commits to continue to operate an appropriate air quality monitoring network to verify the maintenance of the attainment status once the area has been redesignated. The Delaware DAQ has the legal authority to implement and enforce all control measures.
Finally, the Delaware PM2.5 Maintenance Plan includes year 2017 and 2025 on-road motor vehicle emissions budgets for PM2.5 and NOx for use in transportation conformity determinations to assure that any increases in emissions from this sector do not jeopardize continued attainment of the annual PM2.5 standard during the ten-year maintenance period. Delaware???s Maintenance Plan has been prepared in accordance with the requirements specified in EPA???s guidance document, and additional guidance received from EPA staff.
Based on this presentation, New Castle County, Delaware meets the requirements for redesignation under the CAA (Section 107(d)(3)) and EPA guidance for fine particles. Consistent with the authority granted to EPA, the State of Delaware requests that New Castle County, Delaware be redesignated to attainment for the 1997 annual fine particles standard simultaneously with EPA approval of this Delaware State redesignation request and annual PM2.5 Maintenance Plan for the New Castle County portion of the Philadelphia NAA.